
Chemistry, 01.11.2019 09:31 Bra1nPowers
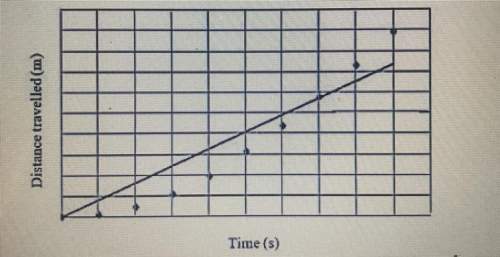
The graph shows the results of an experiment in which the distance travelled by an object was measured against the time travelled for.
using the information above, answer these 3 questions.
a) comment on the shape of the graph drawn for the plotted results.
b) is it possible to decide whether the plotted results are valid? provide a reason for your answer.
c) describe the motion of the object used to do this experiment based on the plotted points. justify your answer.

Answers: 2


Another question on Chemistry
Chemistry, 22.06.2019 04:00
What three natural resources are found in the great lakes region
Answers: 2
Chemistry, 22.06.2019 04:30
Using the periodic table, complete the table to describe each atom. type in your answers
Answers: 3
Chemistry, 22.06.2019 21:40
Tooth enamel consists mainly of the mineral calcium hydroxyapatite, ca_10(po_4)_6(oh)_2. trace elements in teeth of archaeological specimens provide anthropologist with clues about diet and diseases of ancient people. students at hamline university measured strontium in enamel from extracted wisdom teeth by atomic absorption spectroscopy. solutions with a constant total volume of 10.0 ml contained 0.726 mg of dissolved tooth enamel plus variable concentrations of added sr. added sr find the concentration of sr in the 10 ml sample solution in parts per billion = ng/ml. find the concentration of sr in tooth enamel in parts per million = mu g/g.
Answers: 2
You know the right answer?
The graph shows the results of an experiment in which the distance travelled by an object was measur...
Questions

Computers and Technology, 23.08.2019 02:10

Computers and Technology, 23.08.2019 02:10
Computers and Technology, 23.08.2019 02:10
Computers and Technology, 23.08.2019 02:10

English, 23.08.2019 02:10


Mathematics, 23.08.2019 02:10


