
Chemistry, 04.12.2019 05:31 tednequamoore6761
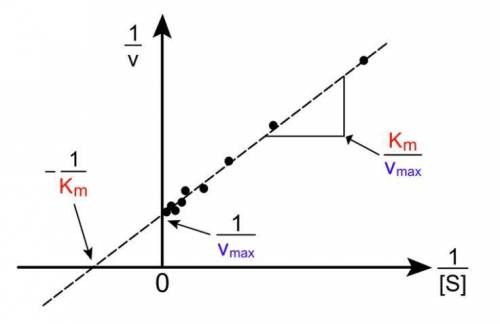
The lineweaver–burk plot, which illustrates the reciprocal of the reaction rate ( 1 / v ) versus the reciprocal of the substrate concentration ( 1 / [ s ] ) , is a graphical representation of enzyme kinetics. this plot is typically used to determine the maximum rate, v max , and the michaelis constant, k m , which can be gleaned from the intercepts and slope. identify each intercept and the slope in terms of the constants v max and k m .

Answers: 1
 y-intercept =
  Slope =


Another question on Chemistry
Chemistry, 22.06.2019 08:30
Which metal exist in liquid state and can be cut with knife ?
Answers: 2
Chemistry, 22.06.2019 12:10
If a molecule with a molecular formula of c13h18 is treated with an excess of h2 in the presence of finally divided pt metal under conditions required for maximum hydrogenation of the molecule to give a molecule with a formula c13h24, how many rings are in the molecule?
Answers: 3
Chemistry, 23.06.2019 03:30
Name atleast 3 type of energy associated with the microwave
Answers: 1
Chemistry, 23.06.2019 07:00
Why do the strengths of london (dispersion) forces generally increase with increasing molecular size? choose one: a. heavier atoms have stronger attractions for each other than lighter atoms. b. dispersion forces are all equal in magnitude; there is no size dependence. c. dispersion forces arise from the attraction between the nuclei of atoms, and larger molecules have larger nuclei. d. dispersion forces arise from dipoles caused by the electron distribution being distorted. larger molecules have more electrons and, therefore, more distortions and a bigger force. e. dispersion forces depend on distance. larger molecules are farther apart and so the forces are smaller.
Answers: 2
You know the right answer?
The lineweaver–burk plot, which illustrates the reciprocal of the reaction rate ( 1 / v ) versus the...
Questions


Mathematics, 14.03.2020 02:38

Mathematics, 14.03.2020 02:38


Computers and Technology, 14.03.2020 02:39


