
Chemistry, 11.03.2020 05:56 QueenNerdy889
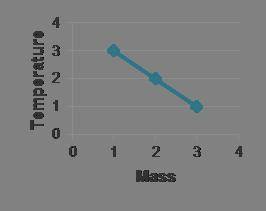
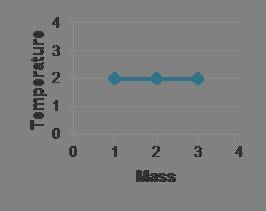
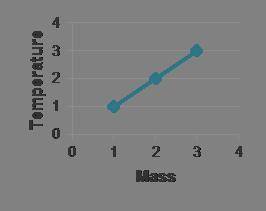
Which graph best demonstrates the general relationship between mass and temperature, similar to the trend of thermal energy absorbed by your sand and water samples?

Answers: 1


Another question on Chemistry
Chemistry, 22.06.2019 04:00
Asample of aluminum foil contains 8.60 × 10²³ atoms. what is the mass of the foil?
Answers: 1
Chemistry, 22.06.2019 14:50
Consider the following multistep reaction: a b→ab(slow) a ab→a2b(fast)−−−−−−−−−−−−−−−−− 2a b→a2b(overall) based on this mechanism, determine the rate law for the overall reaction. express your answer in standard masteringchemistry format. for example, if the rate law is k[a]3[b]2 type k*[a]^3*[b]^2
Answers: 3
Chemistry, 22.06.2019 15:30
Draw the lewis dot structure for each of the following polyatomic ions
Answers: 1
Chemistry, 22.06.2019 19:30
Which one of the following substances would be the most soluble in ccl4? na2so4 h2o ch3ch2ch2ch2oh c4h10 hi
Answers: 1
You know the right answer?
Which graph best demonstrates the general relationship between mass and temperature, similar to the...
Questions

Mathematics, 10.09.2019 16:10

English, 10.09.2019 16:10

History, 10.09.2019 16:10
English, 10.09.2019 16:10

History, 10.09.2019 16:10
English, 10.09.2019 16:10
Mathematics, 10.09.2019 16:10
Chemistry, 10.09.2019 16:10
Chemistry, 10.09.2019 16:10

Mathematics, 10.09.2019 16:10

Computers and Technology, 10.09.2019 16:10


