Consider the energy diagram below.
xn.
A graph with reaction progression on the horizontal ax...

Chemistry, 19.06.2020 00:57 abdominguez7307
Consider the energy diagram below.
xn.
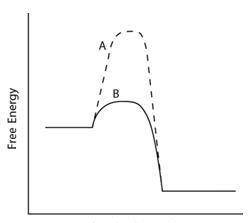
A graph with reaction progression on the horizontal axis and free energy on the vertical axis. 2 curves are shown. Curve A starts near the middle of the axis, runs straight for a distance, then peaks sharply and falls to level out near the horizontal axis. Curve B starts with curve A, but rises much less sharply to a much lower peak before falling with A to level off.
Which line indicates a higher reaction rate?
A because it has a lower activation energy.
B because it has a lower activation energy.
A because its triangleGrxn is much lower.
B because its TriangleGrxn is much lower.

Answers: 3


Another question on Chemistry
Chemistry, 22.06.2019 20:10
Suppose you mix one mole of sulfuric acid (h2so4) with 1 mole of sodium hydroxide(naoh). why does the ph of the solution remain below 7? ( explain so i can get better understanding! )
Answers: 2
Chemistry, 23.06.2019 05:00
How many atomic mass units are equal to 1.672×10⁻²⁴ g of protons?
Answers: 3
You know the right answer?
Questions

English, 21.08.2019 00:30

Mathematics, 21.08.2019 00:30

Biology, 21.08.2019 00:30
Mathematics, 21.08.2019 00:30
Mathematics, 21.08.2019 00:30

Biology, 21.08.2019 00:30
Mathematics, 21.08.2019 00:30
Biology, 21.08.2019 00:30

Social Studies, 21.08.2019 00:30
Social Studies, 21.08.2019 00:30
Mathematics, 21.08.2019 00:30
English, 21.08.2019 00:30


