
Chemistry, 24.06.2020 21:01 carlohillyard4633
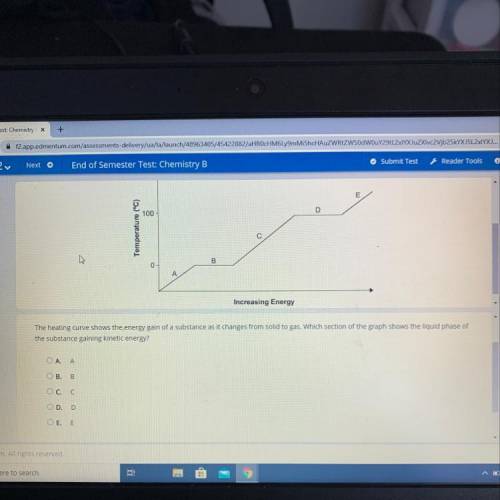
The heating curve shows the energy gain of a substance as it changes from solid to gas. Which section of the graph shows the liquid phase of the substance gaining kinetic energy?
A. A
B. B
C. C
D. D
E. E

Answers: 3


Another question on Chemistry
Chemistry, 22.06.2019 11:50
If oil spills continue, all of the following should be expected except (2 points) death of aquatic life. polluted groundwater. decreased soil productivity. increased global temperatures.
Answers: 3
Chemistry, 22.06.2019 21:00
Once similarity and one difference between a mixture of elements and a mixture of compounds
Answers: 3
Chemistry, 23.06.2019 02:20
In a chemical reaction, the final amount of the products is determined by the a. universal gas law b. law of definite proportions c. air pressure d. temperature e. none of the above me
Answers: 2
You know the right answer?
The heating curve shows the energy gain of a substance as it changes from solid to gas. Which sectio...
Questions

Physics, 13.01.2021 15:30


Computers and Technology, 13.01.2021 15:30


Computers and Technology, 13.01.2021 15:30

Mathematics, 13.01.2021 15:30
English, 13.01.2021 15:30

English, 13.01.2021 15:30


