
Chemistry, 17.12.2020 01:20 hntnhtthnyt
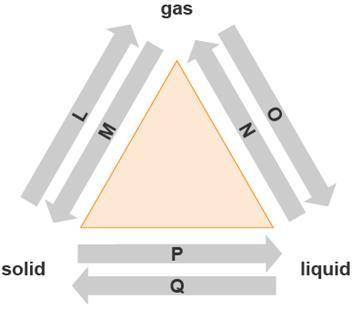
The diagram shows changes of state between solid, liquid, and gas. The atoms of a substance lose energy during a change of state. After the change, the atoms are close together but are able to slide past one another.
A diagram has a triangle at center with gas on top, liquid on bottom right, solid on bottom left. An arrow from gas to liquid is labeled O, and an arrow from liquid to gas is labeled N. An arrow from solid to liquid is labeled P, and an arrow from liquid to solid is labeled Q. An arrow from solid to gas is labeled L, and an arrow from gas to solid is labeled M.
Which arrow represents the change of state described above?
L
N
O
P

Answers: 2


Another question on Chemistry
Chemistry, 22.06.2019 02:10
When 225mg of anthracene, c14h10(s), was burned in a bomb calorimeter the temperature rose by 1.75k. calculate the calorimeter constant. by how much will the temperature rise when 125mg of phenol, c6h5oh(s), is burned in the calorimeter under the same conditions? (δch< (c14h10,s)=–7061 kj mol−1.)
Answers: 3
Chemistry, 22.06.2019 11:50
If oil spills continue, all of the following should be expected except (2 points) death of aquatic life. polluted groundwater. decreased soil productivity. increased global temperatures.
Answers: 3
Chemistry, 22.06.2019 22:30
The diagram shows the relationship between scientific disciplines.the names of some scientific disciplines have been removed from the boxes. which scientific discipline belongs in the blue box? a.physics b.biology c.chemistry d.metallurgy
Answers: 2
You know the right answer?
The diagram shows changes of state between solid, liquid, and gas. The atoms of a substance lose ene...
Questions

History, 29.01.2020 14:04

Mathematics, 29.01.2020 14:04


Biology, 29.01.2020 14:04

Mathematics, 29.01.2020 14:04
Mathematics, 29.01.2020 14:04

Computers and Technology, 29.01.2020 14:04

Biology, 29.01.2020 14:04
Mathematics, 29.01.2020 14:04
Chemistry, 29.01.2020 14:04


