Adaptation:Question 9
On the graph, the dotted line represents the initial distribution of
th...

Adaptation:Question 9
On the graph, the dotted line represents the initial distribution of
the length of Bengal tigers in a population in India. The solid line
represents the length distribution of that population today. The
jungle climate changed when humans began to cut down trees in
much of the jungle. Which describes how adaptation occurs over
time in this population?
1.Only the longest or the shortest tigers survived and reproduced
2.Only the longest tigers survived and reproduced
3.only the medium-sized tigers survived and reproduced
4. Only the shortest tigers survived and reproduced
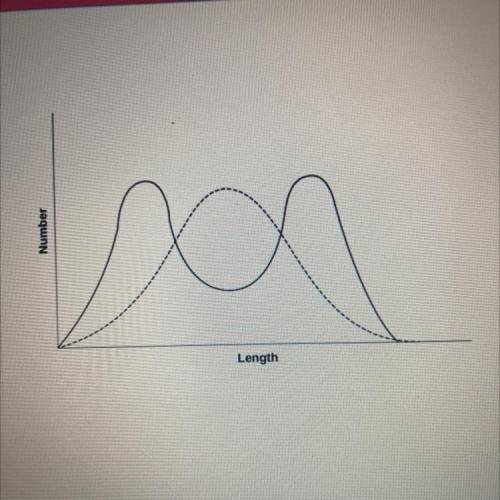

Answers: 2


Another question on Chemistry
Chemistry, 22.06.2019 03:30
Melting and boiling are endothermic processes. this means that these processes absorb energy from their surroundings in order to occur. use this information and the data you collected in the phase change gizmo to describe what happens to the temperature of water when you boil it, then explain why this result occurs.
Answers: 2
Chemistry, 22.06.2019 07:20
After watching the video "zinc strip in copper nitrate solution", and reading the instructions, click on the link labeled "start" just below the drawing of the pencil tip. follow the direction to complete the 3x3 grid. answer the below questions for the portion of the activity in which sn(s) is placed in agno3(aq)
Answers: 1
Chemistry, 22.06.2019 17:10
Acalorimeter is to be calibrated: 51.203 g of water at 55.2 degree c is added to a calorimeter containing 49.783 g of water at 23.5c. after stirring and waiting for the system to equilibrate, the final temperature reached is 37.6 degree c. specific heat capacity of water (s = 4.18 j/g∙degree c). calculate the calorimeter constant. (smδt)warm water = -[(smδt)cold water + (calorimeterδtcold water)]
Answers: 2
Chemistry, 23.06.2019 01:30
Concentrations expressed as a percent by mass are useful when the solute is a a. liquid b. gas c. solid
Answers: 1
You know the right answer?
Questions


Health, 15.02.2021 04:20
Mathematics, 15.02.2021 04:20

History, 15.02.2021 04:20
Health, 15.02.2021 04:20
Mathematics, 15.02.2021 04:20
Mathematics, 15.02.2021 04:20

History, 15.02.2021 04:20


Social Studies, 15.02.2021 04:20
Social Studies, 15.02.2021 04:20
Chemistry, 15.02.2021 04:20
Mathematics, 15.02.2021 04:20


