
Chemistry, 25.01.2021 04:20 masonorourke
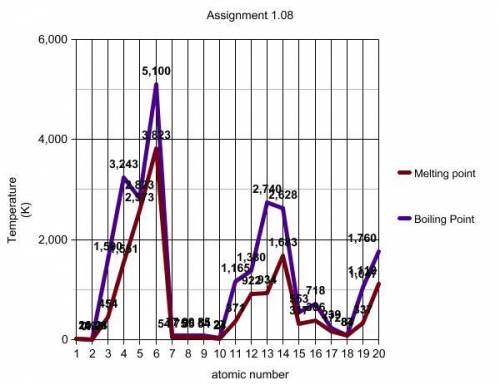
Now look at the segment of the graph between the two data points marked with black squares. Describe how the boiling point and melting point plots behave between these points. (look at the yellow line)
Question 2 options:
There is an increase in melting and boiling points between elements 3 and 7.
There is a decrease in melting and boiling points between elements 3 and 7.
There is no difference in the melting and boiling points between elements 3 and 7.
Question 3
periodic table
On your graph, the data points between the black squares are data for elements with atomic numbers 3 through 9. Locate these elements on your periodic table. What term or description would you use to identify these elements with respect to the periodic table?
Question 3 options:
The elements are in the same period.
The elements are in the same group.
Question 4
picture of graph
Now look at the green lines you created by connecting the three boiling point data points and the three melting point data points. For each of these lines, describe any trends you see.
Question 4 options:
The melting points increase slightly.
The melting points decrease slightly.
There is no change in the melting points.
Question 5
picture of periodic table
Locate the elements on your periodic table that you circled in green on your graph. What term or description would you use to identify these elements with respect to the periodic table?
Question 5 options:
The elements are in the same period.
The elements are in the same group or family.
Question 6
After reviewing your answers to questions 2 and 4 above, would you define boiling point and melting point as a periodic table family trend (vertical groups), period trend (horizontal rows), or neither? Explain your answer in the next question.
Question 6 options:
It is a family trend.
It is a period trend.
It is neither a period or family trend.
Question 7
After reviewing your answers to questions 2 and 4 above, would you define boiling point and melting point as a periodic table family trend (vertical groups), period trend (horizontal rows), or neither? Explain your answer here
Question 7 options:
Skip Toolbars for .
Format
Question 8
picture of graph
Using the room temperature line (orange line) and your periodic table, make lists that identify the state of matter (gas, liquid, or solid) in which each element you plotted exists at room temperature. Explain your answers.

Answers: 3


Another question on Chemistry
Chemistry, 22.06.2019 12:30
Consider the four elements above. which one of these elements will combine with oxygen in a 1: 1 ratio?
Answers: 3
Chemistry, 22.06.2019 20:00
For the reaction c6h14(g) & longrightarrow; c6h6(g) + 4h2(g), δp(h2)/δt was found to be 2.5 x 10⁻² atm/s, where δp(h2) is the change in pressure of hydrogen. determine δp(c6h14)/δt for this reaction at the same time.
Answers: 2
Chemistry, 23.06.2019 08:20
At which temperature would a reaction with ah= -220 kj/mol and as=-0.05 kj/(mol-k) be spontaneous?
Answers: 2
Chemistry, 23.06.2019 08:30
Benzonitrile (c6h5cn) is reduced to two different products depending on the reducing agent used. treatment with lithium aluminum hydride followed by water forms k, which has a molecular ion in its mass spectrum at 107 and the following ir absorptions: 3373, 3290, 3062, 2920, and 1600 cm-1. treatment with a milder reducing agent forms l, which has a molecular ion in its mass spectrum at 106 and the following ir absorptions: 3086, 2850, 2820, 2736, 1703, and 1600 cm-1. l shows fragments in its mass spectrum at m/z = 105 and 77. propose structures for k and l and choose an explanation for how this could be concluded.
Answers: 3
You know the right answer?
Now look at the segment of the graph between the two data points marked with black squares. Describe...
Questions

Mathematics, 16.04.2020 21:36

History, 16.04.2020 21:36
Mathematics, 16.04.2020 21:36
Mathematics, 16.04.2020 21:36


History, 16.04.2020 21:37
Chemistry, 16.04.2020 21:37

History, 16.04.2020 21:37


