
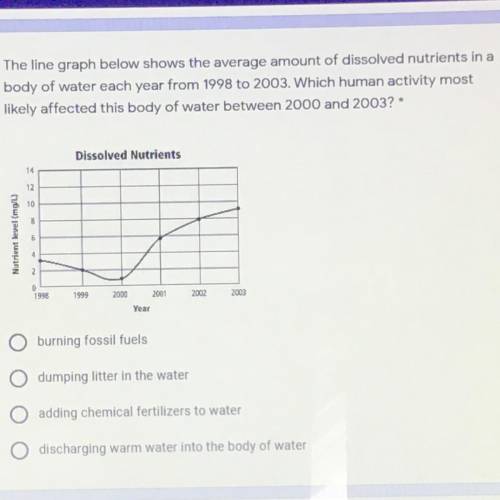
The line graph below shows the average amount of dissolved nutrients in a 1 point
body of water each year from 1998 to 2003. Which human activity most
likely affected this body of water between 2000 and 2003? *
Dissolved Nutrients
14
12
10
Nutrient leveling
4
2
1998
1999
2000
2002
2003
2001
Year
burning fossil fuels
dumping litter in the water
adding chemical fertilizers to water
discharging warm water into the body of water
plz help

Answers: 3


Another question on Chemistry
Chemistry, 23.06.2019 07:30
How do you interpret a chromagram for what mixtures contain?
Answers: 1
Chemistry, 23.06.2019 08:00
How many distinct monochlorinated products, including stereoisomers, can result when the alkane below is heated in the presence of cl2? 3 4 5 6 7?
Answers: 3
You know the right answer?
The line graph below shows the average amount of dissolved nutrients in a 1 point
body of water eac...
Questions

Computers and Technology, 25.07.2019 19:40

Mathematics, 25.07.2019 19:40

Physics, 25.07.2019 19:40


Physics, 25.07.2019 19:40

History, 25.07.2019 19:40
History, 25.07.2019 19:40
Mathematics, 25.07.2019 19:40
Mathematics, 25.07.2019 19:40

Mathematics, 25.07.2019 19:40
History, 25.07.2019 19:40


