
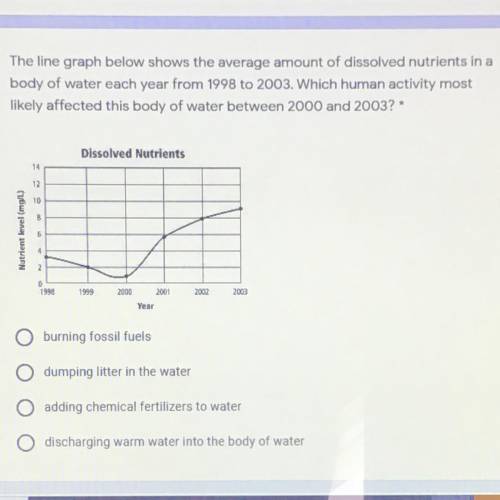
The line graph below shows the average amount of dissolved nutrients in a
body of water each year from 1998 to 2003. Which human activity most
likely affected this body of water between 2000 and 2003? *
The amount of rainfall will increase.
O Rivers may be contaminated by sewage.
Light pollution in the town may decrease
O People will develop more farms in the town.
PLZZ HELP PLZ

Answers: 2


Another question on Chemistry
Chemistry, 22.06.2019 21:30
Describe at least two advantages and two disadvantages of using hydropower as a source of energy.
Answers: 2
Chemistry, 23.06.2019 01:30
Which is an example of a highly unstable isotope that is often used in fission reactions?
Answers: 1
Chemistry, 23.06.2019 06:30
What is the chemical formula for a compound between li and br? libr li2br libr2 libr3
Answers: 1
Chemistry, 23.06.2019 07:00
Agas has an empirical formula ch4. 0.16g of the gas occupies a volume of 240cm^3 what is the molecular formula of the me anyone who !
Answers: 1
You know the right answer?
The line graph below shows the average amount of dissolved nutrients in a
body of water each year f...
Questions

Mathematics, 09.12.2021 04:10

Social Studies, 09.12.2021 04:10
SAT, 09.12.2021 04:10

Mathematics, 09.12.2021 04:10


Computers and Technology, 09.12.2021 04:10
History, 09.12.2021 04:10


