The graph shows how milk production from a herd of cows has changed.
a
8
7
mean g...

Chemistry, 08.02.2021 18:40 blossie94681
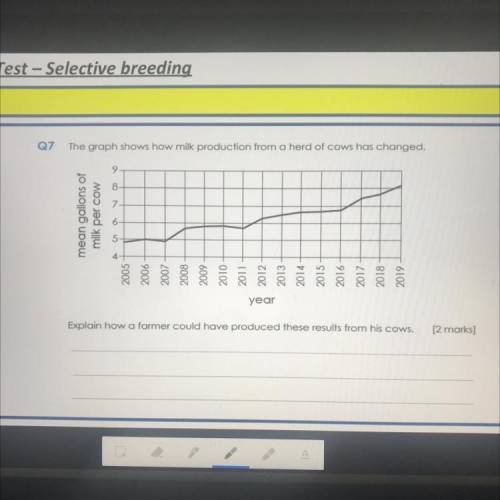
The graph shows how milk production from a herd of cows has changed.
a
8
7
mean gallons of
per cow
milk
6
5
4
2005
9007
2007
2008
2009
2010
2011
2012
2013
2014
2015
2016
2017
2018
2019
year
Explain how a farmer could have produced these results from his cows.

Answers: 1


Another question on Chemistry
Chemistry, 21.06.2019 19:10
Nuclear fusion is the source of energy for stars. besides hydrogen, which other element is most likely also common in stars?
Answers: 1
Chemistry, 22.06.2019 09:20
Give the orbital configuration of the phosphorus (p) atom.
Answers: 1
Chemistry, 22.06.2019 13:30
Ants live on acacia trees in south america. the ants feed on sugars secreted by the trees. the trees provide room for the ants to live. the ants sting any other insect or animal that comes to eat the trees. what type of relationship is this?
Answers: 1
Chemistry, 23.06.2019 01:10
Can someone check my work 98 5.05 acids and bases for this assignment you will be comparing acids and bases. the chart below will you organize the information needed: acids bases chemical properties (2) deodorant detergent vinger dish soap physical properties (2) orange juice toilet cleaner drain cleaner window cleaner ph level acid ph goes from 0-4 bases ph goes from 10-14 examples around you (2) vinger coffee lemon juice dark chocolate
Answers: 3
You know the right answer?
Questions


Arts, 13.06.2020 02:57


Social Studies, 13.06.2020 03:57
Mathematics, 13.06.2020 03:57
Mathematics, 13.06.2020 03:57
Mathematics, 13.06.2020 03:57

Geography, 13.06.2020 03:57


