
Chemistry, 02.03.2021 14:00 iceecole6570
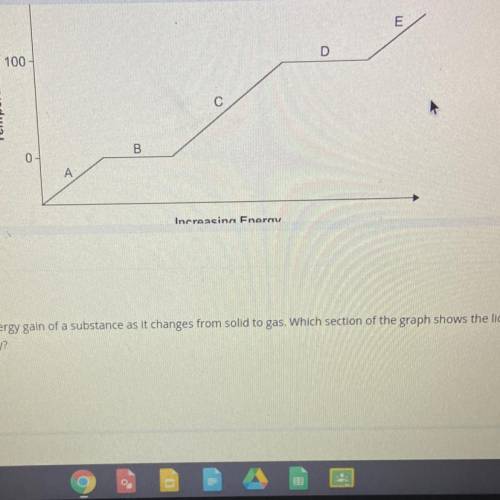
The heating curve shows the energy gain of a substance as it changes from solid to gas. Which section of graph shows the liquid phase of a substance gaining kinectic energy ?

Answers: 1


Another question on Chemistry
Chemistry, 21.06.2019 21:30
The reaction q+r2=r2q is found to be first order in r2 and
Answers: 1
Chemistry, 21.06.2019 23:00
At room temperature what happens to the average kinetic energy of the molecules of a solid, liquid, and a gas
Answers: 2
Chemistry, 22.06.2019 10:50
A100 kmol/h stream that is 97 mole% carbon tetrachloride (ccl4) and 3% carbon disulfide (cs2) is to be recovered from the bottom of a distillation column. the feed to the column is 16 mole% cs2 and 84% ccl4, and 2% of the ccl4 entering the column is contained in the overhead stream leaving the top of the column. calculate the mass and mole fractions of ccl4 in the overhead stream, and determine the molar flow rates of ccl4 and cs2 in the overhead and feed streams. 12. mw_ccla- 153.82; mw_cs2-76.14.
Answers: 3
You know the right answer?
The heating curve shows the energy gain of a substance as it changes from solid to gas. Which sectio...
Questions

Mathematics, 19.05.2021 21:30


Biology, 19.05.2021 21:30
Mathematics, 19.05.2021 21:30
Mathematics, 19.05.2021 21:30


Mathematics, 19.05.2021 21:30

Geography, 19.05.2021 21:30


