
Chemistry, 26.03.2021 18:40 katieleeisaacs8976
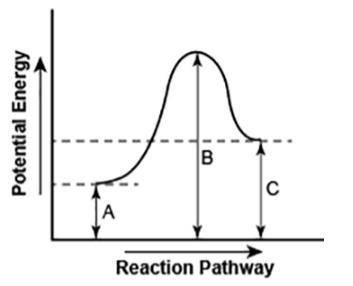
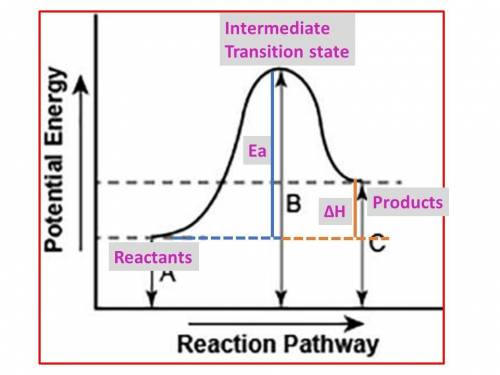
The diagram shows the potential energy changes for a reaction pathway.
A curved lined graph is shown. The y axis of the graph has the title Potential Energy. The x axis of the graph has the title Reaction Pathway. The graph curve begins at a lower level and ends at a slightly higher level. A vertical line labeled A, starting from the x axis till the beginning of the graph line is shown. A vertical line labeled B, starting from where the line labeled A ended, till the uppermost hump in the graph curve is shown. Another vertical line labeled C is shown from starting from the x axis till the point where the graph curve ends.
Part 1: Describe how you can determine the total change in enthalpy and activation energy from the diagram, and if each is positive or negative.
Part 2: Describe how the curve will look if the reaction was exothermic. Be sure to mention changes in the potential energies of the reactants and products and the sign changes of the enthalpy.

Answers: 3


Another question on Chemistry
Chemistry, 21.06.2019 21:00
Read these sentences from the text. near the equator, the tropics receive the most rain on a consistent basis. as a result, the fresh water falling into the ocean decrease the salinity of the surface water in that region. [. .] . . as the salt content of sea water increases, so does its density. what can you infer about how rain affects the density of surface water near the equator?
Answers: 1
Chemistry, 22.06.2019 03:50
What is the temperature of one mole of helium gas at stp?
Answers: 3
Chemistry, 22.06.2019 04:00
Acontainer holds 35.8 moles of gas under 10.0 atm of pressure at 70.0 c. what is the volume of the container?
Answers: 2
Chemistry, 22.06.2019 04:40
In which environment would primary succession occur? a forest with a few remaining trees after a recent wildfire an area of exposed rock after a glacier melts away beach that is exposed to the air at low tide an abandoned baseball field in a small town
Answers: 1
You know the right answer?
The diagram shows the potential energy changes for a reaction pathway.
A curved lined graph is show...
Questions

Mathematics, 17.09.2020 22:01
Mathematics, 17.09.2020 22:01
Mathematics, 17.09.2020 22:01

Social Studies, 17.09.2020 22:01
Mathematics, 17.09.2020 22:01

Biology, 17.09.2020 22:01
Mathematics, 17.09.2020 22:01
Mathematics, 17.09.2020 22:01
Mathematics, 17.09.2020 22:01
Mathematics, 17.09.2020 22:01
Mathematics, 17.09.2020 22:01
Mathematics, 17.09.2020 22:01
Social Studies, 17.09.2020 22:01

Physics, 17.09.2020 22:01

English, 17.09.2020 22:01
Mathematics, 17.09.2020 22:01
Mathematics, 17.09.2020 22:01

World Languages, 17.09.2020 22:01
Mathematics, 17.09.2020 22:01
Mathematics, 17.09.2020 22:01


