
Chemistry, 08.04.2021 03:00 Annabel9554
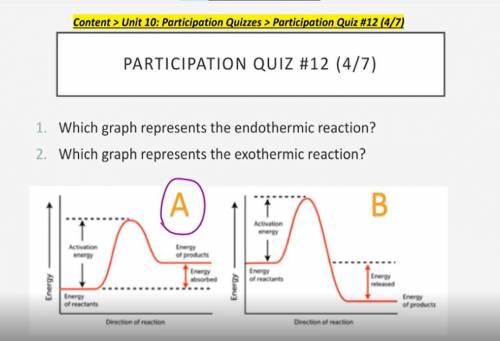
1. Which graph represents the endothermic reaction? 2. Which graph represents the exothermic reaction?

Answers: 3


Another question on Chemistry
Chemistry, 22.06.2019 05:50
Significant figures are digits read directly from the measuring instrument plus one more digit, which is __ by the observer.
Answers: 2
Chemistry, 22.06.2019 21:50
Liquid from a brewery fermentation contains 10% ethanol and 90% water. part of the fermentation product (50,000 kg/h) is pumped to a distillation column on the factory site. under current operating conditions, a distillate of 45% ethanol and 55% water is produced from the top of the column at a rate of one-tenth that of the feed. what is the composition of the waste "bottoms" from the still?
Answers: 2
You know the right answer?
1. Which graph represents the endothermic reaction?
2. Which graph represents the exothermic reacti...
Questions


Chemistry, 10.03.2020 18:01

Spanish, 10.03.2020 18:01

English, 10.03.2020 18:01


Geography, 10.03.2020 18:01


