
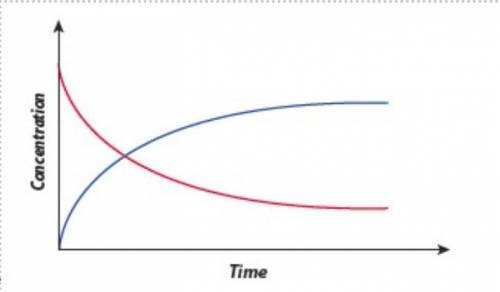
This graph shows changes in concentration during a chemical reaction. Use the definition of reaction rate to explain which curve represents the reactants and which curve represents the products. Explain the shape of each line. What is happening to the reaction rate as the reactant concentration is changed? What is happening where the two lines cross?

Answers: 1


Another question on Chemistry
Chemistry, 22.06.2019 09:20
Which of these statements explains the difference between nuclear binding energy and the strong nuclear force ?
Answers: 3
Chemistry, 22.06.2019 15:30
Using the first volume and temperature reading on the table as v1 and t1, solve for the unknown values in the table below. remember to use the rules of significant figures when entering your numeric response.
Answers: 1
Chemistry, 22.06.2019 19:50
A2.5% (by mass) solution concentration signifies that there is a 2.5 % (by mass) solution concentration signifies that there is blank of solute in every 100 g of solution. of solute in every 100 g of solution
Answers: 3
Chemistry, 22.06.2019 22:00
Choose all the answers that apply. fluorine (f) has an atomic number of 9 and an atomic weight of 18.99. fluorine has a. 9 protons b. 10 neutrons c. 18 electrons d. an atomic mass of 19 e. at least one isotope
Answers: 1
You know the right answer?
This graph shows changes in concentration during a chemical reaction. Use the definition of reaction...
Questions

Mathematics, 13.04.2021 17:40
Mathematics, 13.04.2021 17:40
Mathematics, 13.04.2021 17:40

Mathematics, 13.04.2021 17:40

Physics, 13.04.2021 17:40

Mathematics, 13.04.2021 17:40
Physics, 13.04.2021 17:40


