
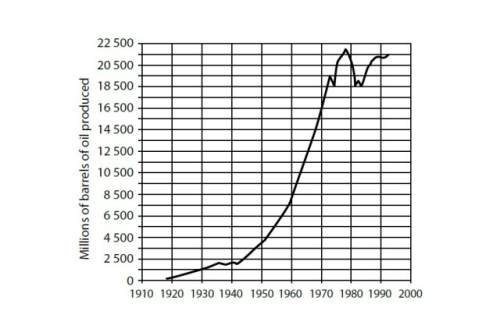
Chemistry, 05.02.2020 06:02 amychan123
A) suggest one possible reason for the general trend indicated on the graph between 1910 and 2000.?
b) is this trend sustainable? why?
c) suggest a plan of action than your household could initiate to reverse the trend.

Answers: 2


Another question on Chemistry
Chemistry, 22.06.2019 00:00
The pressure inside a hydrogen-filled container was 2.10 atm at 21 ? c. what would the pressure be if the container was heated to 92 ? c ?
Answers: 2
Chemistry, 22.06.2019 08:30
Since the gas in your graduated cylinder is a mixture of butane and water vapor, you must determine the partial pressure of the butane, pbutane, alone. to do this, consult a reference and record the partial pressure of the water vapor, pwater, at the temperature you recorded. use the following formula to compute the partial pressure of the butane. pbutane = atmosphere - pwater use the following combined gas law formula and compute the volume that the butane sample will occupy at stp. (hint: convert both temperatures to kelvin.) pbutane x voriginal = pstandard x vfinal troom tstandard use the following ratio and proportion formula to determine the mass of butane needed to occupy a volume of 22.4 l at stp. grams of butane you used “x” grams of butane ml of butane corrected to stp = 22,400 ml compute the theoretical molar mass of butane based on its formula and the atomic masses on the periodic table. compare your experimental results from #3 to the theoretical value of #4, computing a percent error of your findings using this formula: % error = measured value - accepted value x 100 accepted value use the following ratio and proportion formula to determine the mass of butane needed to occupy a volume of 22.4 l at stp. need asap
Answers: 1
Chemistry, 22.06.2019 11:50
If oil spills continue, all of the following should be expected except (2 points) death of aquatic life. polluted groundwater. decreased soil productivity. increased global temperatures.
Answers: 3
You know the right answer?
A) suggest one possible reason for the general trend indicated on the graph between 1910 and 2000.?...
Questions


World Languages, 21.07.2019 10:00

Geography, 21.07.2019 10:00

History, 21.07.2019 10:00
Chemistry, 21.07.2019 10:00


Mathematics, 21.07.2019 10:00
Mathematics, 21.07.2019 10:00

Physics, 21.07.2019 10:00


