
Chemistry, 27.04.2021 01:00 Cjdjejfjiv8568
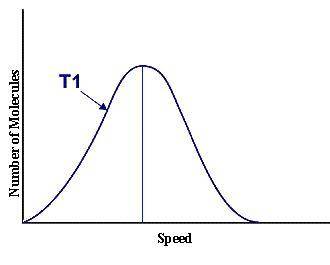
This graph represents a population of molecules in a gas versus the distribution of the average velocity(speed) of its molecules in that population. Assume all molecules to be of the same mass. In reading the graph, it is important to note three things. One, is the most probable speed is at the peak of the curve. Secondly, the most probable speed increases as the temperature increases (so shift to the right), and the distribution broadens as it increases.
On the graph, indicate the average kinetic energy of the population.
Explain your answer.
What part of the graph indicates the temperature of the sample?
Explain your answer.
Print out graph paper (click here for graph paper) and sketch a curve that represents the distribution of molecules at a temperature below the one shown. Label it as T2. Describe both T and T2 in terms of their average kinetic energy. Be specific and detailed.

Answers: 1


Another question on Chemistry
Chemistry, 23.06.2019 03:00
Use the half-reactions of the reaction au(oh)3 + hi -> au +i2 +h2o to answer the questions
Answers: 1
Chemistry, 23.06.2019 11:30
All of the following describe uses of nonrenewable energy sources except
Answers: 3
Chemistry, 23.06.2019 14:40
A1.50-liter sample of dry air in a cylinder exerts a pressure of 3.00 atmospheres at a temperature of 25°c. without changing the temperature, a piston is moved in the cylinder until the pressure in the cylinder is reduced to 1.00 atmospheres. the volume of the gas is
Answers: 3
You know the right answer?
This graph represents a population of molecules in a gas versus the distribution of the average velo...
Questions


History, 04.02.2021 14:00

Mathematics, 04.02.2021 14:00
Mathematics, 04.02.2021 14:00
Mathematics, 04.02.2021 14:00
Physics, 04.02.2021 14:00


Physics, 04.02.2021 14:00
Mathematics, 04.02.2021 14:00
Mathematics, 04.02.2021 14:00
History, 04.02.2021 14:00
Mathematics, 04.02.2021 14:00


