
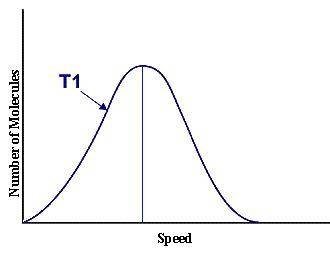
On the graph, indicate the average kinetic energy of the population.
Explain your answer.
What part of the graph indicates the temperature of the sample?
Explain your answer.
Print out graph paper (click here for graph paper) and sketch a curve that represents the distribution of molecules at a temperature below the one shown. Label it as T2. Describe both T and T2 in terms of their average kinetic energy. Be specific and detailed.

Answers: 2


Another question on Chemistry
Chemistry, 22.06.2019 14:00
What mass of natural gas (ch4) must you burn to emit 276 kj of heat?
Answers: 1
Chemistry, 22.06.2019 20:30
Calculate the percent composition by mass of each element in al(oh)3. use at least three significant figures.
Answers: 1
Chemistry, 23.06.2019 00:30
What is bromine+calcium iodide--> calcium bromide +iodine balanced
Answers: 1
You know the right answer?
On the graph, indicate the average kinetic energy of the population.
Explain your answer.
Questions


Mathematics, 13.01.2021 18:00

Arts, 13.01.2021 18:00

Mathematics, 13.01.2021 18:00
Mathematics, 13.01.2021 18:00
Mathematics, 13.01.2021 18:00

Mathematics, 13.01.2021 18:00
Mathematics, 13.01.2021 18:00


