
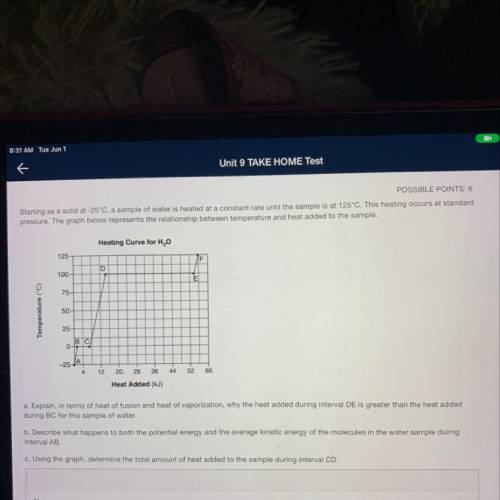
Starting as a solid at -25°C, a sample of water is heated at a constant rate until the sample is at 125°C. This heating occurs at standard
pressure. The graph below represents the relationship between temperature and heat added to the sample.
Heating Curve for H2O
125
F
D
100.
E
75
Temperature (°C)
50.
25
BC
0-
-25-
<
12
20.
28
36
44
52
60.
Heat Added (kJ)
a. Explain, in terms of heat of fusion and heat of vaporization, why the heat added during interval DE is greater than the heat added
during BC for this sample of water.
b. Describe what happens to both the potential energy and the average kinetic energy of the molecules in the water sample duirng
interval AB
c. Using the graph, determine the total amount of heat added to the sample during interval
Please hurry answering all!:)

Answers: 2


Another question on Chemistry
Chemistry, 22.06.2019 08:30
Which part of earth’s surface receives the most direct rays from the sun? a) equator b) ocean c) poles d) mountains
Answers: 2
Chemistry, 22.06.2019 15:40
Use the periodic table to complete this equation that represents nuclear fission processesun - ba c 3 n
Answers: 2
You know the right answer?
Starting as a solid at -25°C, a sample of water is heated at a constant rate until the sample is at...
Questions

Biology, 21.09.2020 17:01

Mathematics, 21.09.2020 17:01

Spanish, 21.09.2020 17:01


Mathematics, 21.09.2020 17:01
Mathematics, 21.09.2020 17:01
Mathematics, 21.09.2020 17:01
Mathematics, 21.09.2020 17:01
Mathematics, 21.09.2020 17:01


