
Chemistry, 19.06.2021 04:20 zanaplen27
PLEASE HELP QUICK
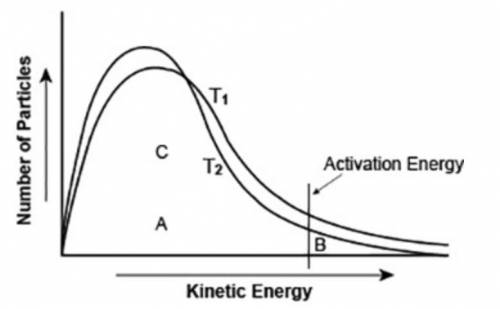
The graph shows the distribution of energy in the particles of two gas samples at different temperatures, T1 and T2. A, B, and C represent individual particles.
Based on the graph, which of the following statements is likely to be true? (3 points)
Particle A is more likely to participate in the reaction than particle B.
Particle C is more likely to participate in the reaction than particle B.
The number of particles able to undergo a chemical reaction is less than the number that is not able to.
More gas particles participate in the reaction at T2 than at T1.

Answers: 2


Another question on Chemistry
Chemistry, 22.06.2019 12:00
Which of the following is an example of physical change not a chemical change? a) a log gives off heat and light as it burns. b) a tree stores energy from the sun in its fruit. c) a penny lost in the grass slowly changes color. d) a water pipe freezes and cracks on a cold night.
Answers: 2
Chemistry, 22.06.2019 13:50
Read the chemical equation. 2c2h2 + 5o2 → 4co2 + 2h2o which of the following statements would be correct if one mole of c2h2 was used in this reaction? one mole of oxygen was used in this reaction. five moles of oxygen were used in this reaction. four moles of carbon dioxide were produced from this reaction. two moles of carbon dioxide were produced from this reaction.
Answers: 3
You know the right answer?
PLEASE HELP QUICK
The graph shows the distribution of energy in the particles of two gas samples at...
Questions

Computers and Technology, 02.12.2021 21:30

Mathematics, 02.12.2021 21:30
Mathematics, 02.12.2021 21:30


History, 02.12.2021 21:30

Arts, 02.12.2021 21:30
Biology, 02.12.2021 21:30
Social Studies, 02.12.2021 21:30


