
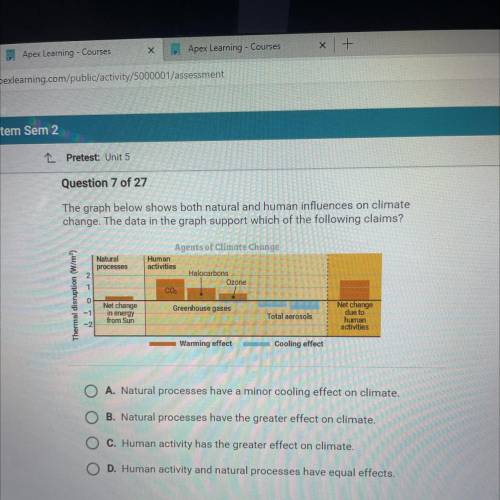
The graph below shows both natural and human influences on climate
change. The data in the graph support which of the following claims?
Natural
processes
Agents of Climate Change
Human
activities
Halocarbons
Ozone
COZ
2
1
Thermal disruption (W/m)
0
Net change
in energy
from Sun
Greenhouse gases
Total aerosols
Net change
due to
human
activities
-2
Warming effect
Cooling effect
O A. Natural processes have a minor cooling effect on climate.
B. Natural processes have the greater effect on climate.
C. Human activity has the greater effect on climate.
O D. Human activity and natural processes have equal effects.

Answers: 3


Another question on Chemistry
Chemistry, 21.06.2019 19:00
0.66y = 0.9x + 0.48 if y has a value of 108.45 what is the value of x?
Answers: 1
Chemistry, 22.06.2019 02:20
Calculate the molarity of 48.0 ml of 6.00 m h2so4 diluted to 0.250 l .
Answers: 1
Chemistry, 22.06.2019 12:30
Avariable that is not being directly tested during an experiment should be changed varied experimented controlled
Answers: 1
You know the right answer?
The graph below shows both natural and human influences on climate
change. The data in the graph su...
Questions


Mathematics, 18.11.2020 20:50

Mathematics, 18.11.2020 20:50
Mathematics, 18.11.2020 20:50
Mathematics, 18.11.2020 20:50
Mathematics, 18.11.2020 20:50


History, 18.11.2020 20:50
Mathematics, 18.11.2020 20:50

Arts, 18.11.2020 20:50
English, 18.11.2020 20:50
Mathematics, 18.11.2020 20:50


