
Chemistry, 20.07.2021 01:00 denvontgekingice
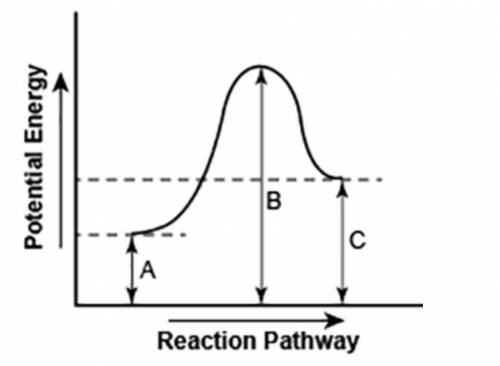
The diagram shows the potential energy changes for a reaction pathway. (10 points)
A curve line graph is shown. The y axis of the graph has the title Potential Energy. The x axis of the graph has the title Reaction Pathway. The curve begins at a lower level and ends at a slightly higher level. A vertical line labeled A, starts from the x axis till the beginning of the graph line. A vertical line labeled B starts from the x axis and continues till the peak of the graph. Another vertical line labeled C is shown from the x axis till the point where the curve ends.
Part 1: Does the diagram illustrate an endothermic or an exothermic reaction? Give reasons in support of your answer.
Part 2: Describe how you can determine the total change in enthalpy and activation energy from the diagram and if each is positive or negative.

Answers: 2


Another question on Chemistry
Chemistry, 22.06.2019 08:00
If 90.0 grams of ethane reacted with excess chlorine,how many grams of dicarbon hexachloride would form
Answers: 1
Chemistry, 22.06.2019 10:00
Water's surface tension and heat storage capacity are accounted for by its a) orbitals b) weight c) hydrogen bonds d) mass e) size
Answers: 2
Chemistry, 22.06.2019 20:30
A40 kilogram skier starts at the top of a 12 meter high slope. at the bottom, she is travelling 10 meters per second. how much energy does she lose to friction
Answers: 2
You know the right answer?
The diagram shows the potential energy changes for a reaction pathway. (10 points)
A curve line gra...
Questions

Mathematics, 23.08.2019 16:30


English, 23.08.2019 16:30

Biology, 23.08.2019 16:30
Physics, 23.08.2019 16:30

History, 23.08.2019 16:30
Mathematics, 23.08.2019 16:30

Computers and Technology, 23.08.2019 16:30
English, 23.08.2019 16:30
Mathematics, 23.08.2019 16:30

Mathematics, 23.08.2019 16:30


