
Chemistry, 20.07.2021 01:00 alfarodougoy8lvt
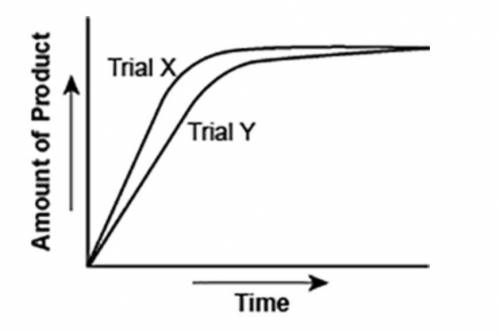
The graph shows the volume of a gaseous product formed during two trials of a reaction. A different concentration of reactant was used during each trial, whereas the other factors were kept constant.
A graph is shown with two graph lines sloping upwards. The title on the x axis is Time and the title on the y axis is Amount of Product. The graph line with a steeper slope is labeled Trial X and the other is labeled Trial Y.
Which of the following statements explains which trial has a lower concentration of the reactant? (5 points)
Trial X, because the final volume of product formed is lower than Trial Y.
Trial X, because this reaction was initially fast and later stopped completely.
Trial Y, because the reaction was initially slow and later stopped completely.
Trial Y, because the volume of product formed per unit time is lower than Trial X.

Answers: 2


Another question on Chemistry
Chemistry, 22.06.2019 00:30
Drive down any three characteristic of modern periodic table
Answers: 1
Chemistry, 22.06.2019 02:20
Calculate the molarity of 48.0 ml of 6.00 m h2so4 diluted to 0.250 l .
Answers: 1
Chemistry, 22.06.2019 12:00
Explain what happens at the saturation point when adding salt to water at room temperature.
Answers: 1
You know the right answer?
The graph shows the volume of a gaseous product formed during two trials of a reaction. A different...
Questions

Physics, 04.08.2019 19:00

Mathematics, 04.08.2019 19:00

English, 04.08.2019 19:00

Biology, 04.08.2019 19:00

History, 04.08.2019 19:00

Social Studies, 04.08.2019 19:00
Mathematics, 04.08.2019 19:00

Business, 04.08.2019 19:00
English, 04.08.2019 19:00

Chemistry, 04.08.2019 19:00
Mathematics, 04.08.2019 19:00


