
Chemistry, 24.09.2021 22:30 TravKeepIt100
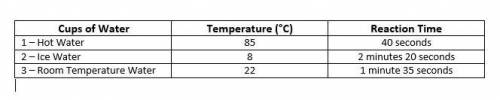
PLS HELP !! use the data graph for reference
Graph title - should include both the independent variable and the dependent variable in the title along with their relationship to each other
Axis Labels - include units
Correct scaling - do not plot the data points as the axis intervals
After the points are plotted, draw a line of best fit/trendline - do not connect the points dot to dot

Answers: 2


Another question on Chemistry
Chemistry, 22.06.2019 15:30
Which statement names the physical property of wood a. wood is softer than coal b. wood does not rust c. wood can rot d. wood can burn
Answers: 1
Chemistry, 22.06.2019 23:30
If it is an isoelectronic series select true, if not select false. o2-, s2-, se2-, te2- na+, k+, rb+, cs+ n3-, p3-, as3-, sb3- ag, cd+, sn3+, sb4+ f-, cl-, br-, i- f-, ne, na+, mg2+ s2-, s, s6+
Answers: 1
Chemistry, 23.06.2019 03:00
In which of the following phases of matter do molecules have the highest amount of energy? a. liquid b. gel c. solid d. gas
Answers: 2
Chemistry, 23.06.2019 05:30
Stoichiometry- i need with 14 and 15! an explanation would be appreciated!
Answers: 1
You know the right answer?
PLS HELP !! use the data graph for reference
Graph title - should include both the independent var...
Questions

Mathematics, 07.12.2021 01:00

Mathematics, 07.12.2021 01:00


Mathematics, 07.12.2021 01:00

Mathematics, 07.12.2021 01:00
English, 07.12.2021 01:00
Mathematics, 07.12.2021 01:00
History, 07.12.2021 01:00
Mathematics, 07.12.2021 01:00
Physics, 07.12.2021 01:00


