
Chemistry, 27.09.2021 19:10 anjumuddin9
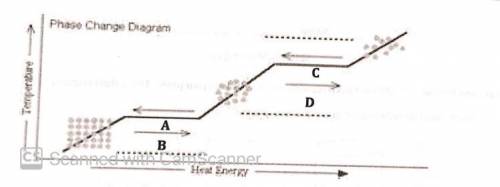
9. In the phase change diagram above, the horizontal lines represent
A. A constant temperature of a substance as it goes through a phase change.
B. A change in temperature of a substance as it goes through a phase change.
C. A period when no phase change occurs.
"A period when heat is not absorbed.

Answers: 2


Another question on Chemistry
Chemistry, 22.06.2019 08:30
7. using your knowledge of colligative properties explain whether sodium chloride or calcium chloride would be a more effective substance to melt the ice on a slick sidewalk. use 3 – 4 sentences in your explanation. 8. when a 2.5 mol of sugar (c12h22o11) are added to a certain amount of water the boiling point is raised by 1 celsius degree. if 2.5 mol of aluminum nitrate is added to the same amount of water, by how much will the boiling point be changed? show all calculations leading to your answer or use 3 – 4 sentences to explain your answer. 9. if 5.40 kcal of heat is added to 1.00 kg of water at 100⁰c, how much steam at 100⁰c is produced? show all calculations leading to an answer. 10. the freezing of water at 0⁰c can be represented as follows: h2o (l) ↔ h2o(s) the density of liquid water is 1.00 g/cm3. the density of ice is 0.92 g/cm3. in 3 – 4 sentences explain why applying pressure causes ice to melt.
Answers: 1
Chemistry, 22.06.2019 14:30
Select all of the statements which are true. electrons are located in shells or orbits around the atom. electrons orbit slowly around the atom. electrons travel in one flat path around the nucleus of an atom. the valence of an atom is determined by the number of electrons in the atom's outermost shell.
Answers: 1
Chemistry, 22.06.2019 18:30
Which sample at stp has the same number of atoms as 18 liters of ne at stp
Answers: 1
You know the right answer?
9. In the phase change diagram above, the horizontal lines represent
A. A constant temperature of...
Questions


Computers and Technology, 06.07.2019 17:20
Mathematics, 06.07.2019 17:20
Mathematics, 06.07.2019 17:20
Physics, 06.07.2019 17:20
Mathematics, 06.07.2019 17:20
History, 06.07.2019 17:20


