
Computers and Technology, 22.01.2020 23:31 art3misdiangelo
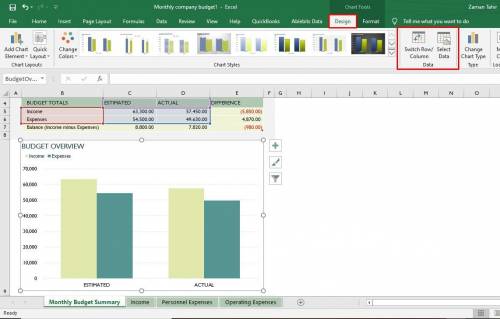
After a chart has been inserted and formatted, is it possible to change the data range it refers to or to add new rows of data? no, additional data cannot be included in a chart once it has been created; the user should delete the chart and create a new chart. yes, click the select data button in the data group under the design tab to extend or reduce the data range. yes, click the chart, select the additional rows or columns of data to add, and press enter on the keyboard. yes, double-click the chart and select properties from the list; in the properties box, insert the new data range to include in the chart.

Answers: 1


Another question on Computers and Technology
Computers and Technology, 22.06.2019 19:40
Solve the following javafx application: write a javafx application that analyzes a word. the user would type the word in a text field, and the application provides three buttons for the following: - one button, when clicked, displays the length of the word.- another button, when clicked, displays the number of vowels in the word.- another button, when clicked, displays the number of uppercase letters in the word(use the gridpane or hbox and vbox to organize the gui controls).
Answers: 1
Computers and Technology, 22.06.2019 23:30
What are listed in the vertical columns across the top of the event editor? a. file names b. conditions c. check marks d. action types
Answers: 1
Computers and Technology, 23.06.2019 16:00
An english teacher would like to divide 8 boys and 10 girls into groups, each with the same combination of boys and girls and nobody left out. what is the greatest number of groups that can be formed?
Answers: 2
Computers and Technology, 23.06.2019 18:00
While inserting images, the picture command is usually used to insert photos from a digital camera, and the clip art command is usually used to a.edit the sizes and other characteristics of photos that have been inserted. b.take a screenshot of an image and copy it to the clipboard for pasting. c.search for drawings or other images from a library of prepared pictures. d.make illustrations using lines and shapes that are easy to manipulate.
Answers: 1
You know the right answer?
After a chart has been inserted and formatted, is it possible to change the data range it refers to...
Questions

Mathematics, 19.04.2021 14:00


Business, 19.04.2021 14:00
Mathematics, 19.04.2021 14:00
Mathematics, 19.04.2021 14:00
Mathematics, 19.04.2021 14:00
Mathematics, 19.04.2021 14:00
Mathematics, 19.04.2021 14:00
Computers and Technology, 19.04.2021 14:00

English, 19.04.2021 14:00
Mathematics, 19.04.2021 14:00
English, 19.04.2021 14:00
Mathematics, 19.04.2021 14:00
Mathematics, 19.04.2021 14:00

History, 19.04.2021 14:00


