The image shows a line graph.
A line graph shows a line along an x and y axis.
Which sc...

Computers and Technology, 11.12.2020 01:10 Jasten
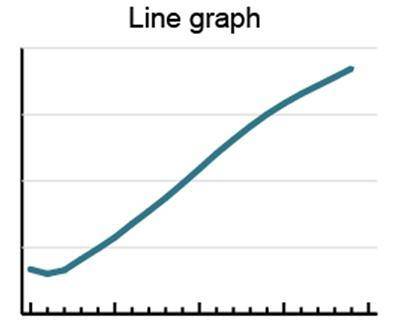
The image shows a line graph.
A line graph shows a line along an x and y axis.
Which scientist is most likely to use this visual aid in a presentation about ocean temperatures?
one who wants to show the process of taking ocean temperatures
one who wants to show the locations of where ocean temperatures were taken
one who wants to show an image of where certain temperatures are found in an ocean
one who wants to show measurements of ocean temperatures in one spot over time

Answers: 1


Another question on Computers and Technology
Computers and Technology, 22.06.2019 11:00
The editing of digital photos us about the same level of difficulty as editing an analog photo
Answers: 2
Computers and Technology, 22.06.2019 12:30
Which of the choices sean are not true when considering virus behavior
Answers: 1
Computers and Technology, 24.06.2019 22:00
Difference between ancient and modern mode of information transmission
Answers: 1
Computers and Technology, 25.06.2019 01:30
What controls can be found on the file tab of microsoft word
Answers: 1
You know the right answer?
Questions

Biology, 21.09.2019 18:30

Chemistry, 21.09.2019 18:30
Biology, 21.09.2019 18:30

Mathematics, 21.09.2019 18:30
Mathematics, 21.09.2019 18:30


History, 21.09.2019 18:30

Social Studies, 21.09.2019 18:30


Geography, 21.09.2019 18:30
Mathematics, 21.09.2019 18:30
Mathematics, 21.09.2019 18:30
Mathematics, 21.09.2019 18:30


