Thinking Critically and Solving Problems
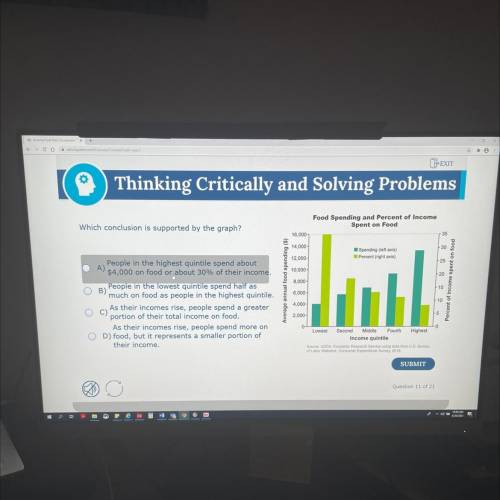
Which conclusion is supported by the graph?
Food Spe...

English, 30.06.2021 18:00 tiwaribianca475
Thinking Critically and Solving Problems
Which conclusion is supported by the graph?
Food Spending and Percent of Income
Spent on Food
16,000
14,000
Spending (eftaris)
Percent (right acis)
12.000-
10,000
People in the highest quintile spend about
OA)
$4,000 on food or about 30% of their income.
People in the lowest quintile spend half as
B)
much on food as people in the highest quintile.
As their incomes rise, people spend a greater
C
portion of their total income on food.
As their incomes rise, people spend more on
D) food, but it represents a smaller portion of
their income.
Average annual food spending

Answers: 3


Another question on English
English, 21.06.2019 16:30
Why does black lung aka arthur morgan let only jhon and abigail go and not sadie in the last chapter
Answers: 1
English, 21.06.2019 22:00
Read this passage.my career in journalism has taught me the challenges of capturing sporting events, yet gregor powell's descriptions are flawless. powell is a gold-medal paralympic swimmer, but his memoir proves that his true strength is the power of his insights.what feature distinguishes this passage as a foreword?
Answers: 1
English, 22.06.2019 03:30
In which case did the court rule that flag burning was not illegal under the first amendment? a-us v. fields b-new york times v. sullivan c-texas v. johnson d-us v. alvarez
Answers: 1
English, 22.06.2019 08:30
Which statement about thoreau's rhetorical style is most accurate?
Answers: 1
You know the right answer?
Questions
English, 21.04.2021 19:50

Mathematics, 21.04.2021 19:50

World Languages, 21.04.2021 19:50
Mathematics, 21.04.2021 19:50
Mathematics, 21.04.2021 19:50
English, 21.04.2021 19:50

Health, 21.04.2021 19:50

Chemistry, 21.04.2021 19:50

Mathematics, 21.04.2021 19:50

Chemistry, 21.04.2021 19:50
Health, 21.04.2021 19:50
Biology, 21.04.2021 19:50
Mathematics, 21.04.2021 19:50
History, 21.04.2021 19:50
History, 21.04.2021 19:50


