
Geography, 20.07.2019 00:00 breannaasmith1122
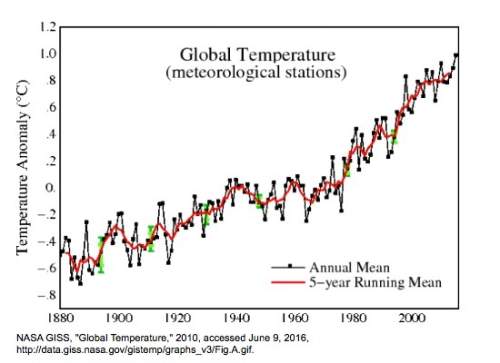
4. analyze the data presented in this graph of global climate data, which shows an anomaly (change) from normal temperatures. use the data to answer the questions. (1 point) nasa giss, "global temperature," 2010, accessed june 9, 2016, 1.the last year shown on the graph is 2000, and the graph shows data for 2010. based on the trends shown on the graph, what would you predict the anomaly to be in 2020? 2.what effects on earth's systems are likely to result from these changes to our climate? what changes to the environment do you think might have caused this pattern?

Answers: 1


Another question on Geography
Geography, 23.06.2019 16:50
Due to its high humidity, the south often experiences severe storms with heavy rains called cyclones ,hurricanes, monsoons, tornadoes
Answers: 3
Geography, 23.06.2019 17:00
Seafood watch is a program that identifies sustainably harvested, ocean friendly seafood in order to
Answers: 3
Geography, 24.06.2019 00:30
Formidable obstacles of climate, terrain, and distance hinder exploitation of natural resources in russia. true false
Answers: 1
You know the right answer?
4. analyze the data presented in this graph of global climate data, which shows an anomaly (change)...
Questions


Biology, 04.05.2021 21:40
Mathematics, 04.05.2021 21:40

Mathematics, 04.05.2021 21:40
Mathematics, 04.05.2021 21:40

History, 04.05.2021 21:40


Arts, 04.05.2021 21:40


