
Geography, 05.06.2020 03:59 finessinsam
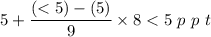
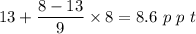
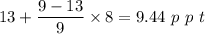
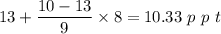
A line graph, titled Amount of Air Pollution Parcticles by State, shows Parts per trillion or p p t, and Years 2006 through 2015 for Virginia, Wyoming, North Carolina, Tennessee, and Maryland. The line for Wyoming starts at 5 p p t with little change, ending just below 5 p p t. The line for Virginia starts at 13 p p t and ends at 8 p p t. The line for North Carolina starts at 13 p p t and ends just below 9 p p t. The line for Maryland starts just above 13 p p t and ends at 10 p p t. The line for Tennessee starts near 13.5 and ends at 9 p p t.
Use the graph to answer the following questions.
Which state has the highest level of air pollution particles for the year 2014?
Which state shows the least change in air pollution particles from 2006 to 2015?
What action is most likely to have helped reduce the rate of air pollution particles?

Answers: 1


Another question on Geography
Geography, 22.06.2019 13:20
Gemstones are commonly found in pegmatites, which are igneous rocks that are a. exceptionally mafic b. exceptionally coarse grained c. exceptionally fine grained d. extrusive, forming from lava
Answers: 2
Geography, 23.06.2019 01:00
Agricultural practices in the united states nearly led to the extinction of the peregrine falcon during the 1950s and 60s.
Answers: 1
Geography, 23.06.2019 18:00
Venezuela’s economy relies most heavily on which of the followingvenezuela’s economy relies most heavily on which of the following? a. oil reserves in places such as the eastern llanos b. cattle ranching in the grasslands c. fertile farmland in the andean highlands d. coffee plantations in mountainous areas
Answers: 3
You know the right answer?
A line graph, titled Amount of Air Pollution Parcticles by State, shows Parts per trillion or p p t,...
Questions

Business, 09.12.2021 05:00

Mathematics, 09.12.2021 05:00

History, 09.12.2021 05:00


Arts, 09.12.2021 05:00
Mathematics, 09.12.2021 05:00


Mathematics, 09.12.2021 05:00


