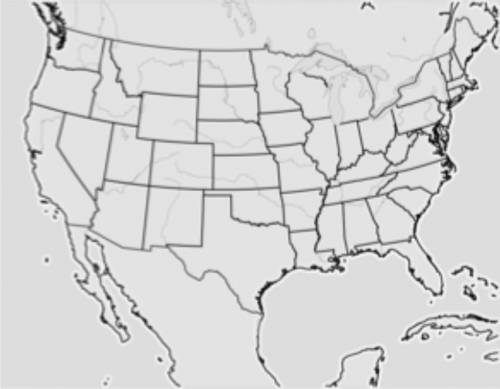
Use the data on the weather map from July 4, 2006 to create a weather map and a weather forecast for the next day. Include the locations of fronts, highs, lows, and precipitation. Use these forecasting tips to create the weather maps: If there is a lot of water vapor in the air and a cold front is approaching, precipitation is most likely on its way, too. A change in air pressure means there will most likely be a change in weather. Falling air pressure generally means rain. Rising air pressure generally means clearing skies. Air masses and fronts generally move west to east. Use these tips to create a written forecast: Write as if you are a weather forecaster explaining the forecast to a viewing audience. Explain the weather maps. Describe changes in pressure, temperature, and precipitation. Weather Map: July 5, 2006 (Attached) Forecast: July 5, 2006 Apprentice Self-Evaluation Evaluate your own work by answering these questions. What was most challenging about forecasting the weather? How did this project prepare you to be a real meteorologist? What do you need more practice doing before you are promoted to entry-level meteorologist? Part 2 Create a Map Obtain or draw a map of your state or area. (AREA - Euless, STATE - TX) Describe the geography of the area. Draw the geographical features of your area. Geographical features can include, but are not limited to, the following: Mountains Large bodies of water such as the Great Lakes, oceans, or bays Plains Remember to submit your map with the assignment. Data Collection For ten days, record the temperature, air pressure, precipitation, and wind speed/direction for your area. Data Analysis Analyze the weather data and map to answer the questions. What weather patterns are present in your area? How do the geography and geographical features of your area affect the temperature? How do the geography and geographical features of your area affect the precipitation? How do the geography and geographical features of your area affect the weather in the area?


Answers: 2


Another question on Geography

Geography, 22.06.2019 22:00
There is only one climate type in motion across the world at a time
Answers: 3

Geography, 23.06.2019 11:00
Triangle with the the sides 72 and 75 and x. also other trsingle withsides 24 25 and 7. what is the value of x.
Answers: 1

Geography, 23.06.2019 23:00
The majority of australians live in the w. urban rimx. tropical northy. outbackz. sunshine coast
Answers: 2

Geography, 24.06.2019 11:00
What conclusion can be drawn about the location of the city of syracuse? it was built on the coastline due to easy access to the red sea. it was built on the coastline due to easy access to the mediterranean sea. it was built inland to protect it from invaders sailing in from the mediterranean sea. it was built inland to protect it from invaders sailing in from the red sea.
Answers: 1
You know the right answer?
Use the data on the weather map from July 4, 2006 to create a weather map and a weather forecast for...
Questions

English, 06.12.2019 14:31


Biology, 06.12.2019 14:31

Mathematics, 06.12.2019 14:31

History, 06.12.2019 14:31

Mathematics, 06.12.2019 14:31


Biology, 06.12.2019 14:31


Mathematics, 06.12.2019 14:31

Chemistry, 06.12.2019 14:31


Mathematics, 06.12.2019 14:31

Social Studies, 06.12.2019 14:31


