WILL GIVE BRAINLIEST!
DAIRY FARMS IN THE UNITED STATES
Source: United States Department of Ag...

Geography, 12.10.2020 20:01 Suheily218
WILL GIVE BRAINLIEST!
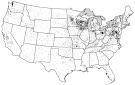
DAIRY FARMS IN THE UNITED STATES
Source: United States Department of Agriculture, Census of Agriculture, 2012
The map shows the distribution of dairy farms across the Lower 48 of the United States. Each dot on the map represents approximately ten dairy farms.
A. Identify ONE type of boundary data shown on the map.
B. Identify the region of the United States where most dairy farms are located.
C. Identify ONE spatial pattern shown on the map.
D. Describe the characteristic land use associated with the spatial pattern shown on the map.
E. Describe TWO geographic features not shown on the map that would help explain the patterns of dairy farming shown on the map.

Answers: 1


Another question on Geography
Geography, 22.06.2019 02:30
Which number shows the location of the united kingdom of great britain? 7 5 2 4
Answers: 1
Geography, 22.06.2019 09:30
Quick i have a question on my exam review and i have my exam tmr. how does the taiga region change as your cross canada. make sure it’s canada!you : )
Answers: 3
Geography, 22.06.2019 16:20
Amountain is larger than a hill, with steep sides true or false
Answers: 1
Geography, 23.06.2019 05:50
Asap will mark geography final plz ! what are the benefits of international aid? (give me the right evidence )
Answers: 1
You know the right answer?
Questions

Mathematics, 25.02.2021 09:30


Mathematics, 25.02.2021 09:30
Mathematics, 25.02.2021 09:30

English, 25.02.2021 09:30

Business, 25.02.2021 09:30
Chemistry, 25.02.2021 09:30
Mathematics, 25.02.2021 09:30
English, 25.02.2021 09:30

Business, 25.02.2021 09:30


