
Geography, 17.11.2020 01:40 lilinicholeb
Analyze the chart below and answer the question that follows.
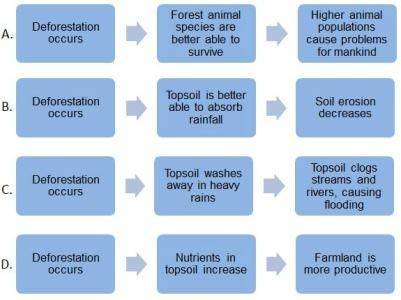
A chart with 12 bubbles with arrows pointing to the next bubble and 3 bubbles in each row. Row A is Deforestation occurs, Forest animal species are better able to survive, Higher animal populations cause problems for mankind. Row B is Deforestation occurs, Topsoil is better able to absorb rainfall, Soil erosion decreases. Row C is Deforestation occurs, Topsoil washes away in heavy rains, Topsoil clogs streams and rivers causing flooding. Row D is Deforestation occurs, Nutrients in topsoil increase, Farmland is more productive.
Image by e2020
In the chart above, which of the sequences describes a negative consequence of deforestation?
A.
Sequence A
B.
Sequence B
C.
Sequence C
D.
Sequence D
Please select the best answer from the choices provided
A
B
C
D

Answers: 3


Another question on Geography
Geography, 23.06.2019 03:30
Concealer circle oh in which arc xy measures 16 pi centimeters the length of the radius of the circle is 32 cm what is the circumference of the circle
Answers: 1
Geography, 24.06.2019 11:00
The days of the “midnight sun,” when the sun never really sets at night, occur during what season?
Answers: 1
Geography, 24.06.2019 11:30
What causes the drought cycles in africa? a. the jet stream b. mount kilimanjaro c. monsoon climate zones d. quickly evaporating rainwater
Answers: 1
You know the right answer?
Analyze the chart below and answer the question that follows.
A chart with 12 bubbles with arrows p...
Questions

Mathematics, 03.10.2019 00:00

History, 03.10.2019 00:00


Social Studies, 03.10.2019 00:00

Mathematics, 03.10.2019 00:00
Mathematics, 03.10.2019 00:00

Mathematics, 03.10.2019 00:00
Biology, 03.10.2019 00:00

Social Studies, 03.10.2019 00:00
History, 03.10.2019 00:00

Biology, 03.10.2019 00:00


