
Geography, 18.11.2019 19:31 stinematesa
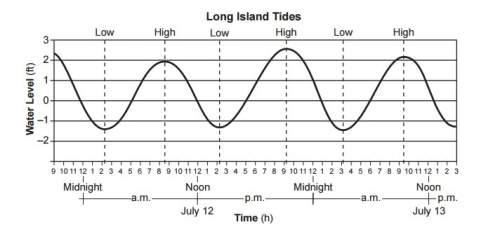
The graph below shows ocean water levels for a shoreline location on long island, new york. the graph
also indicates the dates and times of high and low tides.
based on the data, the next high tide occurred at approximately
(1) 4 p. m. on july 13
(2) 10 p. m. on july 13
(3) 4 p. m. on july 14
(4) 10 p. m. on july 14

Answers: 2


Another question on Geography
Geography, 23.06.2019 22:30
Ron is moving to oceania because his mining company recently opened a new operation there. to which of the following islands is ron most likely going? a. papua new guinea b. bikini atoll c. tahiti d. palmyra atoll
Answers: 1
Geography, 24.06.2019 04:00
Explain the differences between convergent, divergent, and transform fault boundaries.
Answers: 2
Geography, 24.06.2019 19:30
How has plate tectonics affected the climate of south america?
Answers: 1
You know the right answer?
The graph below shows ocean water levels for a shoreline location on long island, new york. the grap...
Questions


Health, 06.09.2019 02:30


Computers and Technology, 06.09.2019 02:30


