
Geography, 24.05.2021 05:40 Frankie103947
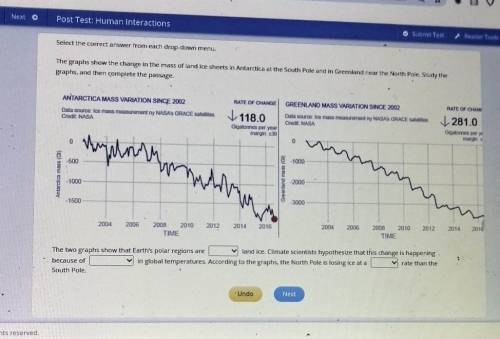
The graphs show the change in the mass of land ice sheets in Antarctica at the south Pole and in Greenland near the North Pole. Study the graphs, and then complete the passage. The two graphs show that Earth's polar regions are _ land Ice. Climate scientists hypothesize that this change is happening because of_ in global temperatures. According to the graphs, the North Pole is losing ice at a _ rate than the South Pole.
blank 1 =
A. gaining
B. losing
blank 2=
A. an increase
B. a decrease
blank 3=
A. slower
B. faster

Answers: 1


Another question on Geography
Geography, 23.06.2019 13:00
Which country in the video has the highest population growth rate?
Answers: 1
Geography, 24.06.2019 11:00
What happens when heat from inside earth is transferred to its surface? warmer material is pushed to the crust more dense material is pushed to the crust warmer material is pushed to the outer core less dense material is pushed to the outer core
Answers: 2
You know the right answer?
The graphs show the change in the mass of land ice sheets in Antarctica at the south Pole and in Gre...
Questions

Mathematics, 11.08.2019 17:10

Health, 11.08.2019 17:10

Physics, 11.08.2019 17:10


Computers and Technology, 11.08.2019 17:10

English, 11.08.2019 17:10
Mathematics, 11.08.2019 18:10
Mathematics, 11.08.2019 18:10
Mathematics, 11.08.2019 18:10


