
Geography, 28.06.2021 18:40 tiwaribianca475
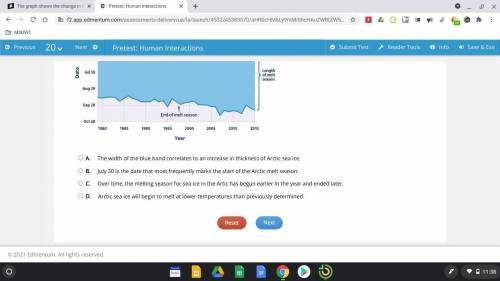
The graph shows the change in the duration of the sea-ice melt season in the Arctic from 1980 to 2015. The blue band represents the time between when ice began to melt and when it froze each year. Which conclusion can you draw from the graph?
A.
The width of the blue band correlates to an increase in thickness of Arctic sea ice.
B.
July 30 is the date that most frequently marks the start of the Arctic melt season.
C.
Over time, the melting season for sea ice in the Artic has begun earlier in the year and ended later.
D.
Arctic sea ice will begin to melt at lower temperatures than previously determined.

Answers: 2


Another question on Geography
Geography, 22.06.2019 17:00
The african continent is home of the worlds largest desert and longest river . t or f
Answers: 1
Geography, 22.06.2019 19:10
What's erosion? a. the breakdown of rock into smaller pieces b. the removal of weathered products from rock c. a change in rock resulting from exposure to water d. a chemical change in rock that weakens it
Answers: 2
Geography, 23.06.2019 07:00
In order from largest to smallest what are earths five main oceans
Answers: 1
You know the right answer?
The graph shows the change in the duration of the sea-ice melt season in the Arctic from 1980 to 201...
Questions

Mathematics, 30.09.2020 01:01

History, 30.09.2020 01:01
Geography, 30.09.2020 01:01

Mathematics, 30.09.2020 01:01
English, 30.09.2020 01:01

Chemistry, 30.09.2020 01:01
Mathematics, 30.09.2020 01:01

Social Studies, 30.09.2020 01:01
Mathematics, 30.09.2020 01:01

Mathematics, 30.09.2020 01:01
Mathematics, 30.09.2020 01:01


