This line graph shows the united states population from 1800 to 2000.
what change does t...

History, 07.10.2019 05:30 BeeShyanne
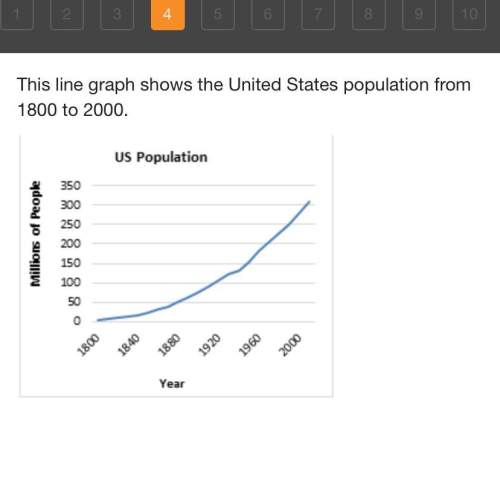
This line graph shows the united states population from 1800 to 2000.
what change does this graph show from 1800 to 1880?
a) the us population increased slightly during that time
b) the us population increased sharply during that time
c) the us population decreased slightly that time.
d) the us population decreased sharply during that time.

Answers: 2


Another question on History
History, 21.06.2019 16:10
What is the importance of the american anti slavery society founded
Answers: 1
History, 21.06.2019 23:00
During what century did muhammad recieve his first revelation from god
Answers: 1
History, 22.06.2019 01:00
Which statement about the draft during the vietnam war is true a. many young men were drafted b. only college students were drafted c. both men and women were drafted d. the military was made up entirely of volunteers
Answers: 1
You know the right answer?
Questions


Computers and Technology, 03.02.2020 23:54

Chemistry, 03.02.2020 23:54

Mathematics, 03.02.2020 23:54

History, 03.02.2020 23:55

Spanish, 03.02.2020 23:55
Chemistry, 03.02.2020 23:55
Computers and Technology, 03.02.2020 23:55
Mathematics, 03.02.2020 23:55


