This graph shows data on deaths caused by measles. what trend does the graph show?
a. t...

History, 16.10.2019 19:30 destinymitchell966
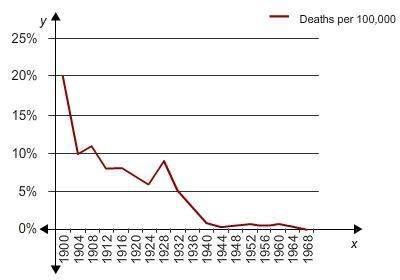
This graph shows data on deaths caused by measles. what trend does the graph show?
a. there is likely to be a big growth in the number of deaths caused by a measles outbreak before 2020.
b. the number of deaths due to measles was higher than from other diseases until 1928.
c. the number of deaths due to measles will most likely remain low in the future.
d. the number of deaths due to measles decreased each year since 1904.

Answers: 1


Another question on History
History, 21.06.2019 17:00
What would lead a historian to consider two events to have a relationship of correlation rather than causation?
Answers: 1
History, 22.06.2019 00:30
Match the person to the information contributed to luke's writings. 1. paul 2. luke 3. philip 4. eyewitnesses 5. james a. investigated everything about the life of christ b. provided firsthand descriptions of events c. may have provided text of stephen's address and the story of his martyrdom d. may have described the appointment of deacons, and the conversion of the ethiopian eunich and the samaritans e. may have provided the information about the day of pentacost
Answers: 3
History, 22.06.2019 04:00
Forty years later, the fall of saigon remains a pivotal and emotional event to many. you will now conduct research to find two find two different representations of this historical event. first, you will find an image connected to the fall of saigon. then, you will find a second source of your choosing that represents the same topic
Answers: 3
You know the right answer?
Questions


Mathematics, 03.12.2020 18:30
Mathematics, 03.12.2020 18:30

Mathematics, 03.12.2020 18:30
Mathematics, 03.12.2020 18:30

Mathematics, 03.12.2020 18:30
Mathematics, 03.12.2020 18:30
Mathematics, 03.12.2020 18:30
Social Studies, 03.12.2020 18:30
History, 03.12.2020 18:30
Mathematics, 03.12.2020 18:30

Health, 03.12.2020 18:30
Mathematics, 03.12.2020 18:30


