Glapy suusa
quiz
active
time remaining
39: 57
a pie chart like this on...

History, 17.12.2019 18:31 sanchez626
Glapy suusa
quiz
active
time remaining
39: 57
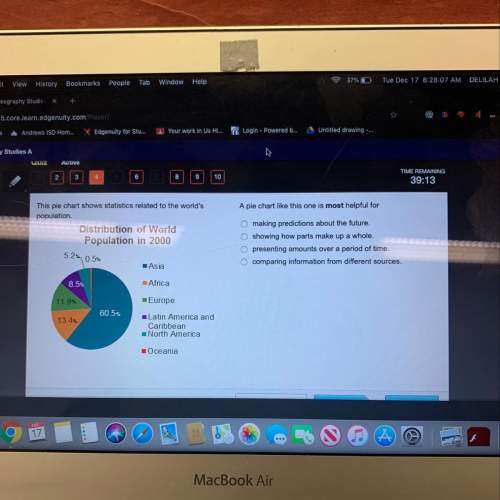
a pie chart like this one is most for
this pie chart shows statistics related to the world's
population.
distribution of world
population in 2000
o making predictions about the future.
o showing how parts make up a whole.
o presenting amounts over a period of time.
o comparing information from different sources.
5.2% 0.5%
asia
8.5%
africa
11.9%
europe
60.5%
13.4%
latin america and
caribbean
north america
oceania

Answers: 3


Another question on History
History, 21.06.2019 21:00
Which of the following events happen during president hardings term? a) the supreme court decided to break up large corporations. b) the supreme court strength and state laws protection labor union. c) the supreme court ruled in favor of extended regulations of child labor. d)the supreme court made it easier for large businesses to operate.
Answers: 1
History, 21.06.2019 23:00
Describe the relations between the united states and other countries under the articles of confederation. 3-4 sentences
Answers: 3
History, 22.06.2019 06:00
Ilive in michigan i went to iowa and killed someone i then went to florida for vacation i got caught for the iowa murder wile kicking back on the beach in miami where will i be tried
Answers: 1
History, 22.06.2019 07:30
What would be considered a secondary source about the assasination of abraham lincoln
Answers: 2
You know the right answer?
Questions


History, 21.01.2021 23:10

History, 21.01.2021 23:10

Mathematics, 21.01.2021 23:10

Advanced Placement (AP), 21.01.2021 23:10
Mathematics, 21.01.2021 23:10
Mathematics, 21.01.2021 23:10
English, 21.01.2021 23:10

Arts, 21.01.2021 23:10


