Drag each bar to the correct location on the graph.
Use the data provided in the table to comp...

History, 24.03.2020 01:03 carinaorcutt
Drag each bar to the correct location on the graph.
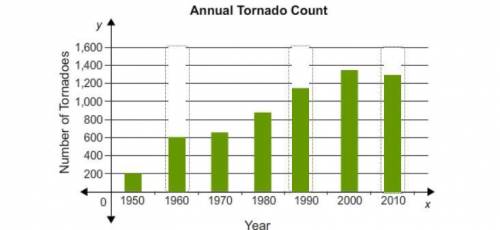
Use the data provided in the table to complete the graph showing the number of tornadoes that occurred each year in the United States
between 1950 and 2010.
Year Number of Tornadoes
1950 200
1960 600
1970 660
1980 880
1990 1,150
2000 1,350
2010 1.300
O 2020 Edmentum. All rights reserved.
O
E
5:20

Answers: 1


Another question on History
History, 21.06.2019 23:30
What role and side did italy fight on during world war 1? why did they change sides? write this in your own words.
Answers: 1
History, 22.06.2019 05:00
Who were the only people that were not allowed to be a citizen in the roman empire
Answers: 1
History, 22.06.2019 13:30
What actions are the pope asking the university of oxford to take against wycliffe
Answers: 1
You know the right answer?
Questions


Physics, 29.09.2019 10:00


Mathematics, 29.09.2019 10:10
Mathematics, 29.09.2019 10:10

Mathematics, 29.09.2019 10:10
Biology, 29.09.2019 10:10
Mathematics, 29.09.2019 10:10
Mathematics, 29.09.2019 10:10
History, 29.09.2019 10:10
Physics, 29.09.2019 10:10
Mathematics, 29.09.2019 10:10


