Look at the graph. Then answer the question.
1929 Drop in Stock Prices
A gra...

History, 09.04.2020 08:21 keshewar2671
Look at the graph. Then answer the question.
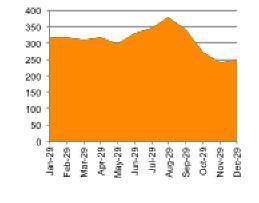
1929 Drop in Stock Prices
A graph titled 1929 Drop in Stock Prices shows dates on the horizontal axis and numbers on the vertical axis. Prices were constant around 300 from January to May, increased from 300 in May to 375 in August, decreased from 375 in August to 250 in November, and remained constant from November to December.
Which statement best explains what happened in the stock market from August to the end of October?
The market increased its value.
The market lost much of its value.
The market totally collapsed.
The market slowly inched upward.

Answers: 2


Another question on History
History, 21.06.2019 13:30
Explain the difference between a physical change and chemical change
Answers: 1
History, 21.06.2019 18:00
What do the tuareg culture and the candomblé faith have in common? a. both originated in the south pacific. b. both appropriated cultural traditions from multiple sources. c. both developed close ties with the catholic church. d. both have a long history of religious persecution.
Answers: 3
You know the right answer?
Questions


English, 17.06.2021 18:50


Mathematics, 17.06.2021 18:50
Mathematics, 17.06.2021 18:50
Mathematics, 17.06.2021 18:50
Mathematics, 17.06.2021 18:50
English, 17.06.2021 18:50
Physics, 17.06.2021 18:50
SAT, 17.06.2021 18:50
English, 17.06.2021 18:50


