Look at the circle graph.
US Incomes, 1890
A circle graph titled U S Incomes...

History, 25.04.2020 18:15 thanitoast84
Look at the circle graph.
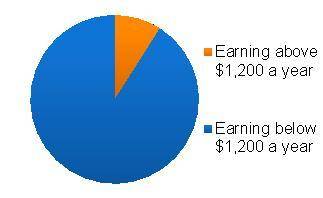
US Incomes, 1890
A circle graph titled U S Incomes, 1890. About one-tenth of the pie is shaded orange and labeled Earning above 1,200 dollars a year. The rest of the pie is labeled Earning below 1,200 dollars a year.
What does the graph tell you about the balance of income during the late 1800s?
a) Most people did not earn more than $1,200 in a year.
b) Most people earned enough money to support their families.
c) Most people earned about the same amount of money.
d) Most people were factory or company owners.

Answers: 1


Another question on History
History, 21.06.2019 14:00
La pintura escena de inquisición, hecha por francisco goya, muestra
Answers: 2
History, 22.06.2019 10:00
The term “iron curtain” was based on an actual iron curtain that german theaters used to separate the stage from the audience in case of a fire. who or what did the “iron curtain” of the cold war separate? democratic nations from communist nations the soviet union from its allies the united states from europe europe from asia
Answers: 1
History, 22.06.2019 10:30
Which statement about congress is accurate? it contains only the house of representatives. the senate’s membership is based on a state’s population. it is bicameral, according to the constitution. membership in both houses is based on equal representation.
Answers: 1
You know the right answer?
Questions

Mathematics, 18.03.2022 19:30


Social Studies, 18.03.2022 19:30
Mathematics, 18.03.2022 19:30


Social Studies, 18.03.2022 19:30
Mathematics, 18.03.2022 19:30
Mathematics, 18.03.2022 19:30

English, 18.03.2022 19:30
English, 18.03.2022 19:40


Computers and Technology, 18.03.2022 19:40


