The graph shows world human population from 10,000 BCE - 2000 CE.
Graph of world human p...

History, 30.05.2020 20:05 kelseeygee
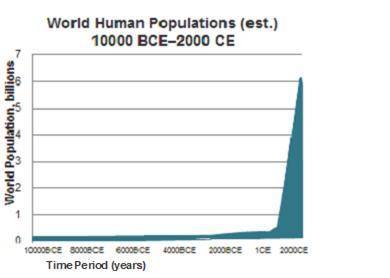
The graph shows world human population from 10,000 BCE - 2000 CE.
Graph of world human populations (e s t) from 10000 B C E to 2000 C E in billions. Population stayed steady in 10000, 8000, 6000, and 4000 B C E. Population started to rise in 2000 B C E and 1 CE. Population rose dramatically after.
Based on the graph, we can predict that the global population today has
begun a gradual drop.
declined dramatically.
remained the same.
continued to increase.

Answers: 3


Another question on History
History, 21.06.2019 17:30
The inventor cocreated the film fred arts sneeze which was one of the first american movies
Answers: 3
History, 21.06.2019 18:00
How did enlightenment ideologies influence the declaration of independence is f he rights of man and citizen
Answers: 1
History, 21.06.2019 21:30
Which piece of legislation granted african americans the right to vote
Answers: 1
History, 22.06.2019 04:00
What does law number eight of hammurabi’s code describe the punishment for
Answers: 1
You know the right answer?
Questions

Mathematics, 20.01.2021 20:50
Mathematics, 20.01.2021 20:50

Mathematics, 20.01.2021 20:50
Mathematics, 20.01.2021 20:50
Mathematics, 20.01.2021 20:50
English, 20.01.2021 20:50


Mathematics, 20.01.2021 20:50

Social Studies, 20.01.2021 20:50
Mathematics, 20.01.2021 20:50
Mathematics, 20.01.2021 20:50
Mathematics, 20.01.2021 20:50
Mathematics, 20.01.2021 20:50

Biology, 20.01.2021 20:50


