
History, 08.06.2020 04:57 silviamgarcia
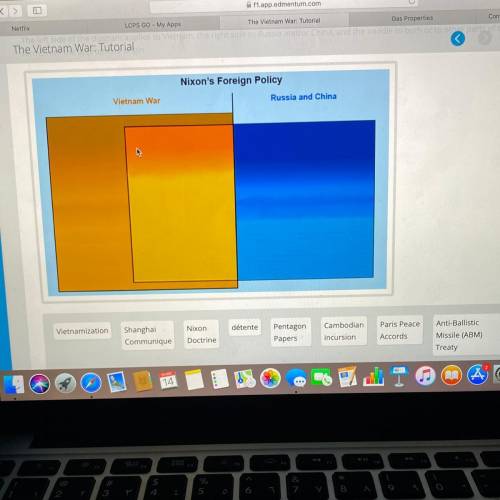
Drag each label to the correct location on the image. The left side of the diagram applies to Vietnam, the right side to Russia and/or China, and the middle to both or to other parts of the world. Match the terms with the appropriate origin.
1.vietnam war
2.both
3. russia and china
VietnamizationShanghai. Communique. Nixon Doctrine. détente. PentagonPapers. Cambodianincursion. ParisPeaceAccords. Anti-Ballistic Missile (ABM) Treaty. covertCIA action. de-escalation. Christmasbombing.
Strategic Arms Limitation Talks,

Answers: 1


Another question on History
History, 21.06.2019 15:30
1. describe events that explain the border differences between these maps. use information from the maps and the lesson in your response. use complete sentences. 2.besides land, what did the united states gain from expansion? use information from the maps and the lesson in your response. use complete sentences. 3. people disagree whether the united states should have gone to war against mexico. should the united states have declared war? consider information from the lesson and maps to explain your claim with at least two reasons. the united states _ _ _ _ _ _ _ _ _ _ _ _ _ _ _ _ _ _ _ _ _ _ _ _ _ because _ _ _ _ _ _ _ _ _ _ _ _ _ _ _ _ _ _ _ _ _ _ _ _ _ _ _ _ _ _ _ _ _ _ _ _ _ _ _ _ _ _ _ _ _ _ _ _ _ _ _ _ _ _ _ _ _ _ _ _ _ _ _ _ _. a second reason is _ _ _ _ _ _ _ _ _ _ _ _ _ _ _ _ _ _ _ _ _ _ _ _ _ _ _ _ _ _ _ _ _ _ _ _ _ _ _ _ _ _ _ _ _ _ _ _ _ _ _ _ _ _ _ _ _ _ _ _ _ _ _ _ _ _ _ _ _ _ _ _ _ _ _ _ _ _. 4. reporter mcquill mentions your claim will be stronger if you respond well to someone who disagrees with you. use this framework to challenge a counterclaim. even though some people think that _ _ _ _ _ _ _ _ _ _ _ _ _ _ _ _ _ _ _ _ _ _ _ _ _ _ _ _ _ _ _ _ _ _ _ _ _ _ _ _ _ _ _ _ _ _ _ _ _ _ _ _ _ _ _ _ _ _ _ _ _ _ _ _ _ _ _ _ _ _ _ _ _ _ _ _ _ _ _ _ _ _ _ _ _ _ _ _ _ _ _ _ _ _ _ _ _ _ _ _ _ _ _ _ _ _ _ _ _ _ _ _ _ _ _ _ _.
Answers: 1
History, 21.06.2019 19:30
Faust is written by? a. adam smithb. hitlerc. goethed. karl marx
Answers: 2
History, 22.06.2019 03:00
This pie chart shows statistics related to the world's population. a pie chart like this one is most for making predictions about the future. showing how parts make up a whole. presenting amounts over a period of time. comparing information from different sources.
Answers: 2
You know the right answer?
Drag each label to the correct location on the image. The left side of the diagram applies to Vietna...
Questions

Mathematics, 23.05.2021 20:10

Social Studies, 23.05.2021 20:10

Physics, 23.05.2021 20:10

Mathematics, 23.05.2021 20:10
History, 23.05.2021 20:10
Social Studies, 23.05.2021 20:20
Physics, 23.05.2021 20:20
Physics, 23.05.2021 20:20

Biology, 23.05.2021 20:20
Mathematics, 23.05.2021 20:20
Mathematics, 23.05.2021 20:20
Mathematics, 23.05.2021 20:20
History, 23.05.2021 20:20

Chemistry, 23.05.2021 20:20


