
History, 11.06.2020 19:57 stgitskaysie9028
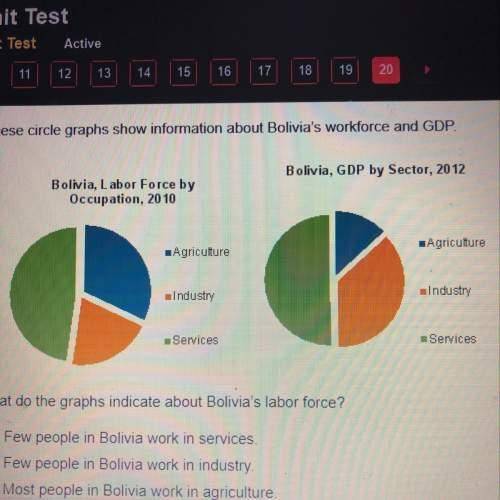
These circle graphs show information about Bolivia’s workforce and GDP. Two pie charts are shown. The first is titled Bolivia, Labor Force by Occupation, 2010. Agriculture is 32 percent, Industry is 20 percent, and Services is 48 percent. The second is titled Bolivia, G D P by Sector, 2012. Agriculture is 13.6 percent, Industry is 38.1 percent, and Services is 52 percent. What do the graphs indicate about Bolivia’s labor force? Few people in Bolivia work in services. Few people in Bolivia work in industry. Most people in Bolivia work in agriculture. Most people in Bolivia work in industry.

Answers: 1


Another question on History
History, 21.06.2019 15:30
Nicole machiavelli’s famous work, the was about the qualities that made an ideal leader
Answers: 1
History, 21.06.2019 18:30
Which statement best explainsthe role of government according to john locke
Answers: 2
History, 21.06.2019 19:00
How do you think entrepreneurs contribute or industry in america? describe your answer
Answers: 1
History, 22.06.2019 02:00
The enforcement clause of the fourteenth amendment states what congress had the authority to a. grant citizenship to people b. change the constitution c. enforce only the bill of rights d. make laws to apply the amendment
Answers: 1
You know the right answer?
These circle graphs show information about Bolivia’s workforce and GDP. Two pie charts are shown. Th...
Questions


Computers and Technology, 10.11.2020 22:10


Mathematics, 10.11.2020 22:10
Mathematics, 10.11.2020 22:10
Mathematics, 10.11.2020 22:10
Mathematics, 10.11.2020 22:10
Mathematics, 10.11.2020 22:10
Social Studies, 10.11.2020 22:10
History, 10.11.2020 22:10
Engineering, 10.11.2020 22:10


