History, 20.11.2020 16:20 allysongonzalezlove0
1.
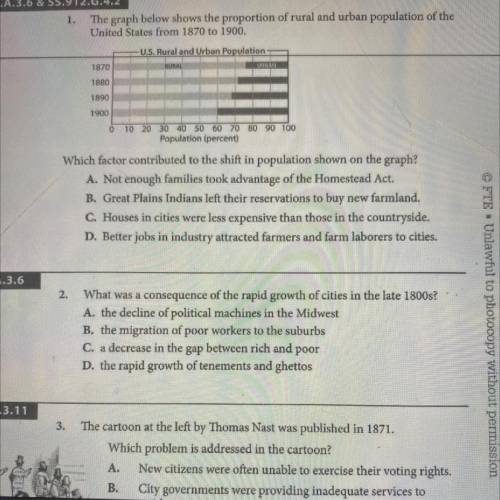
The graph below shows the proportion of rural and urban population of the
United States from 1870 to 1900.
U. S. Rural and Urban Populationum
1870
TERURAL
HURUAN
1880
1890
3111
1900
0
10 20 30 40 50 60 70 80 90 100
Population (percent)
Which factor contributed to the shift in population shown on the graph?
A. Not enough families took advantage of the Homestead Act.
B. Great Plains Indians left their reservations to buy new farmland.
C. Houses in cities were less expensive than those in the countryside.
D. Better jobs in industry attracted farmers and farm laborers to cities.
© FTE Unlawf


Answers: 1


Another question on History

History, 22.06.2019 02:30
What is significant about official languages in russian republics? why would it matter?
Answers: 3

History, 22.06.2019 10:00
Why did poland, hungary, and east germany join the warsaw pact? a)their people voted to join in free elections. b)their efforts to join nato failed. c)they wanted to stop the spread of communism in europe. d)they were soviet satellites that had little choice.
Answers: 2

History, 22.06.2019 12:00
What was the relationship between japan and the united states in the early 1900s?
Answers: 1

History, 22.06.2019 12:30
What are accurate statements about eleanor roosevelt's early life. choose all answers that are correct
Answers: 1
You know the right answer?
1.
The graph below shows the proportion of rural and urban population of the
United States fr...
United States fr...
Questions

Physics, 02.02.2021 03:30

Mathematics, 02.02.2021 03:30

Mathematics, 02.02.2021 03:30

Social Studies, 02.02.2021 03:30


Chemistry, 02.02.2021 03:30


English, 02.02.2021 03:30


Mathematics, 02.02.2021 03:30

Mathematics, 02.02.2021 03:30


Medicine, 02.02.2021 03:30


Mathematics, 02.02.2021 03:30


Mathematics, 02.02.2021 03:30


