
History, 20.11.2020 19:00 ayoismeisjjjjuan
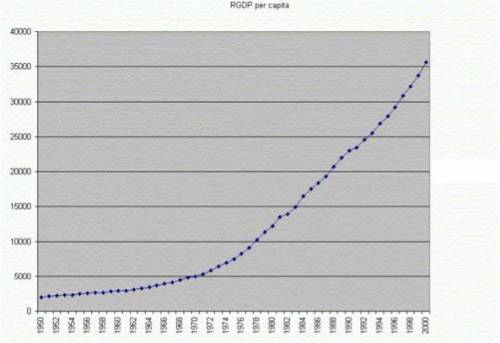
The graph below shows the per capita gross domestic product (GDP) in the United States from 1940 to 1980. Per capita GDP measures each person's share of the economy:
Which factor explains the trend shown on this graph?
growth of the U. S. population resulting from the baby boom
growth of U. S. productivity resulting from industrial expansion
growth of the federal budget resulting from increased defense spending
growth of imports resulting from increased consumer borrowing and
spending

Answers: 2


Another question on History
History, 21.06.2019 16:30
Ideological parties are generally associated with this person? a.wolfe b.marx c. locke d.paine
Answers: 1
History, 21.06.2019 18:50
John locke would have agreed with all of the following statemens except
Answers: 2
History, 21.06.2019 22:30
(10 points! ) why did the other allies like great britain and france not support president wilsons 14 points?
Answers: 1
You know the right answer?
The graph below shows the per capita gross domestic product (GDP) in the United States from 1940 to...
Questions


Social Studies, 14.10.2019 13:30

Mathematics, 14.10.2019 13:30

Mathematics, 14.10.2019 13:30
Biology, 14.10.2019 13:30


History, 14.10.2019 13:30


