
History, 16.12.2020 01:00 maddie3354
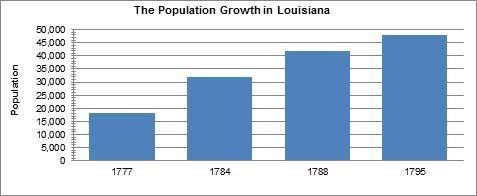
The graph shows population growth in Louisiana in the late 18th century.
What does this graph show about the period between 1777 and 1784?
It was the period of slowest population growth on the chart.
It was the period of fastest population growth on the chart.
It was the period when no population growth occurred.
It was the second fastest increase of population on the chart.

Answers: 1


Another question on History
History, 21.06.2019 20:30
Why was russia drawn into a conflict with germany after ausria-hungary declared war on serbia ?
Answers: 2
History, 21.06.2019 21:30
By the end of the 1800s, there was a change in the nature of the immigrants coming to the united states. immigration from northern europe—england, ireland, germany, and scandinavia—declined, while immigration from italy, russia, and austria-hungary grew. in fact, between 1900 and 1910, more than three-fourths of all immigrants came from these three countries. unfortunately, these countries were far removed england, the home of our founders, and the immigrants who came from them had a hard time adjusting to life in their new country.
Answers: 2
History, 22.06.2019 01:50
Why was the nationalist party more popular in china’s cities than in the countryside?
Answers: 3
You know the right answer?
The graph shows population growth in Louisiana in the late 18th century.
What does this graph show...
Questions


Medicine, 13.11.2021 14:50

History, 13.11.2021 14:50

Business, 13.11.2021 14:50

Chemistry, 13.11.2021 14:50
Biology, 13.11.2021 14:50

English, 13.11.2021 15:00
History, 13.11.2021 15:00
English, 13.11.2021 15:00


