Question 4 (1 point)
(05.01 HC)
The following chart shows population trends in Germany during...

History, 11.01.2021 18:30 yesman1288
Question 4 (1 point)
(05.01 HC)
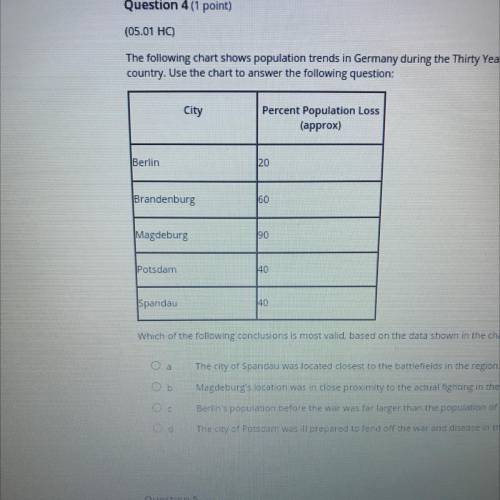
The following chart shows population trends in Germany during the Thirty Years' War (1618-1648), when plague, famine, and war struck that
country. Use the chart to answer the following question:
City
Percent Population Loss
(approx)
Berlin
120
Brandenburg
50
Magdeburg
90
Potsdam
140
Spandau
140
Which of the following conclusions is most valid, based on the data shown in the chart? (1 point)
Oo
Ob
The city of Spandau was located closest to the battlefields in the region
Magdeburg's location was in close proximity to the actual fighting in the war.
Berlin's population before the war was far larger than the population of the other cities;
The city of Potsdam was ill prepared to fend off the war and disease in the region
Od

Answers: 3


Another question on History
History, 21.06.2019 19:00
The collapse of the roman empire most likely to empower the catholic church because
Answers: 3
History, 21.06.2019 23:50
1. what was the purpose of the communist international organization?
Answers: 3
History, 22.06.2019 02:00
Ineed asap! ! what is the name of the system in which each branch of the u.s government can limit the actions of the other branches? a. perpetual union b. division of powers c. cooperative federalism d. checks and balances
Answers: 1
You know the right answer?
Questions

English, 23.01.2021 01:00

Mathematics, 23.01.2021 01:00


Mathematics, 23.01.2021 01:00
History, 23.01.2021 01:00
Mathematics, 23.01.2021 01:00
History, 23.01.2021 01:00
English, 23.01.2021 01:00
Mathematics, 23.01.2021 01:00
Mathematics, 23.01.2021 01:00
Mathematics, 23.01.2021 01:00


