
History, 17.01.2021 20:20 wowihavefun
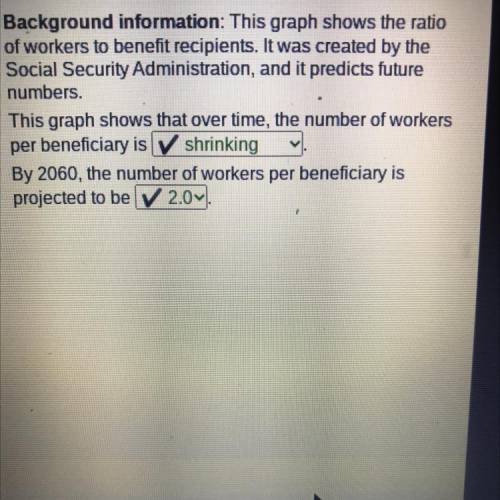
Background information: This graph shows the ratio
of workers to benefit recipients. It was created by the
Social Security Administration, and it predicts future
numbers.
This graph shows that over time, the number of workers
per beneficiary is V shrinking
By 2060, the number of workers per beneficiary is
projected to be v 2.04.

Answers: 1


Another question on History
History, 22.06.2019 02:30
Text: dante's inferno canto iv analyze the setting that dante develops in canto iv. examine how 1) the choices he makes to describe the setting and 2) the characters he places in this setting affect the reader's understanding of the first circle of hell, limbo. be sure to use specific details from the text to support your ideas
Answers: 2
History, 22.06.2019 02:30
How was the creation of money handled under the arrival of confederation
Answers: 1
History, 22.06.2019 03:30
Which statement best summarizes how interpreted in very strict terms government have changed over time
Answers: 1
History, 22.06.2019 04:30
What occupation did muhammad have before the first revelation? politician military general trader religious leader mark this and retum save and exit
Answers: 2
You know the right answer?
Background information: This graph shows the ratio
of workers to benefit recipients. It was created...
Questions

Mathematics, 05.03.2021 01:30
Mathematics, 05.03.2021 01:30
History, 05.03.2021 01:30
Mathematics, 05.03.2021 01:30
Mathematics, 05.03.2021 01:30
Mathematics, 05.03.2021 01:30

Mathematics, 05.03.2021 01:30

Biology, 05.03.2021 01:30
Biology, 05.03.2021 01:30
Mathematics, 05.03.2021 01:30
Mathematics, 05.03.2021 01:30
Mathematics, 05.03.2021 01:30
Mathematics, 05.03.2021 01:30

Chemistry, 05.03.2021 01:30


